Table of Contents (Globus Toolkit) -- INCOMPLETE
1. Introduction
2. Setting up the first machine
2.1. Pre-requisites
2.2. Building the Toolkit
2.3. Setting up security on your first machine
2.4. Set up GridFTP
2.5. Starting the webservices container
2.6. Configuring RFT
2.7. Setting up WS GRAM
3. Setting up your second machine
3.1. Setting up your second machine: Prereqs
3.2. Setting up your second machine: Installation
3.3. Setting up your second machine: Security
3.4. Setting up your second machine: GridFTP
3.5. Setting up your second machine: Webservices
3.6. Setting up your second machine: WS GRAM
4. VO-level services
4.1. Setting up an Index Service hierarchy
4.2. Configuring WebMDS
4.3. Creating a MyProxy server
5. Setting up your cluster
5.1. Cluster: prereqs
5.2. Cluster: install
5.3. Security on the cluster
5.4. GridFTP on the cluster
5.5. Cluster: Container
5.6. Cluster: RFT
5.7. Cluster: GRAM
5.8. Cluster: MDS
6. Establishing Cross-CA Trust
7. Now what?
1. Introduction
This is a quickstart that shows a full installation of the Toolkit on two Centos 5 machines. It shows the installation of prereqs, installation of the toolkit, creation of certificates, and configuration of services. It is designed to supplement the main admin guide.
The installer used throughout this document is the GT4.0.8 installer. There are no changes required to use this document with later 4.0.8 installers. You should use the most current version available.
2. Setting up the first machine
2.1. Pre-requisites
I will be installing all of the toolkit from source, so I'm going to double-check my system for pre-requisites. The full list of prereqs is available at Software Prerequisites in the Admin Guide.
First I'll check for zlib development libraries for GSI-OpenSSH:
choate % yum install zlib zlib-devel gcc gcc-c++ tar sed make perl sudo postgresql postgresql-server postgresql-odbc xinetd
Next, I'll install java from Sun, you can download from here.
root@choate:~# cd /opt
root@choate:~# ./jdk-6u13-linux-i586.bin
root@choate:~# mv jdk1.6.0_13 java
Next, we download from here, install ant:
root@choate:~# cd /opt
root@choate:~# tar xzf apache-ant-1.7.1-bin.tar.gz
root@choate:~# mv apache-ant-1.7.1 ant
Aslo need to set JAVA_HOME and ANT_HOME
Add below entry in /etc/profile
export JAVA_HOME=/opt/java
export ANT_HOME=/opt/ant
export GLOBUS_LOCATION=/usr/local/globus-4.0.1
export PATH=$JAVA_HOME/bin:$ANT_HOME/bin:$GLOBUS_LOCATION/bin:$GLOBUS_LOCATION/sbin:$PATH
2.2. Building the Toolkit
That completes the list of build prereqs, so now I will download the installer from here and build it. The long version of these instructions is at Installing in the Admin Guide.
root@cognito:~# useradd globus
root@choate:/etc/init.d# mkdir /usr/local/globus-4.0.1/
root@choate:/etc/init.d# chown globus:globus /usr/local/globus-4.0.1/
Now, as the newly created globus user:
root@cognito:~# su - globus
globus@choate:~$ tar xzf gt4.0.8-all-source-installer.tar.gz
globus@choate:~$ cd gt4.0.8-all-source-installer
globus@choate:~/gt4.0.8-all-source-installer$ ./configure --prefix=/usr/local/globus-4.0.1/ \
--with-iodbc=/usr/lib
checking build system type... i686-pc-linux-gnu
checking for javac... /usr/java/j2sdk1.4.2_10//bin/javac
checking for ant... /usr/local/apache-ant-1.6.5/bin/ant
configure: creating ./config.status
config.status: creating Makefile
Much better!
[Note]
Note
The machine I am installing on doesn't have access to a scheduler. If it did, I would have specified one of the wsgram scheduler options, like --enable-wsgram-condor, --enable-wsgram-lsf, or --enable-wsgram-pbs.
Now it's time to build the toolkit:
globus@choate:~/gt4.0.1-all-source-installer$ make | tee installer.log
cd gpt-3.2autotools2004 && OBJECT_MODE=32 ./build_gpt
build_gpt ====> installing GPT into /usr/local/globus-4.0.1/
...
Time for a coffee break here, the build will take over an hour, possibly
longer depending on how fast your machine is
...
echo "Your build completed successfully. Please run make install."
Your build completed successfully. Please run make install.
globus@choate:~/gt4.0.1-all-source-installer$ make install
/usr/local/globus-4.0.1//sbin/gpt-postinstall
...
..Done
globus@choate:~/gt4.0.1-all-source-installer$
2.3. Setting up security on your first machine
Now that the toolkit is installed, we're going to want hostcerts for the machine, and a usercert for me. To do that, we're going to use the SimpleCA that is distributed with the toolkit. Here's how we set it up, based on the instructions at SimpleCA Admin:
globus@choate:~$ source $GLOBUS_LOCATION/etc/globus-user-env.sh
globus@choate:~$ $GLOBUS_LOCATION/setup/globus/setup-simple-ca
WARNING: GPT_LOCATION not set, assuming:
GPT_LOCATION=/usr/local/globus-4.0.1
C e r t i f i c a t e A u t h o r i t y S e t u p
This script will setup a Certificate Authority for signing Globus
users certificates. It will also generate a simple CA package
that can be distributed to the users of the CA.
The CA information about the certificates it distributes will
be kept in:
/home/globus/.globus/simpleCA/
/usr/local/globus-4.0.1/setup/globus/setup-simple-ca: line 250:
test: res: integer expression expected
The unique subject name for this CA is:
cn=Globus Simple CA, ou=simpleCA-choate.mcs.anl.gov, ou=GlobusTest, o=Grid
Do you want to keep this as the CA subject (y/n) [y]:
y
Enter the email of the CA (this is the email where certificate
requests will be sent to be signed by the CA): bacon@choate
The CA certificate has an expiration date. Keep in mind that
once the CA certificate has expired, all the certificates
signed by that CA become invalid. A CA should regenerate
the CA certificate and start re-issuing ca-setup packages
before the actual CA certificate expires. This can be done
by re-running this setup script. Enter the number of DAYS
the CA certificate should last before it expires.
[default: 5 years (1825 days)]:RETURN
Enter PEM pass phrase:******
Verifying - Enter PEM pass phrase:******
/bin/sed: can't read /tmp//globus_tmp_ca_setup//pkgdata/pkg_data_src.gpt.tmpl:
No such file or directory
creating CA config package...
A self-signed certificate has been generated
for the Certificate Authority with the subject:
/O=Grid/OU=GlobusTest/OU=simpleCA-choate.mcs.anl.gov/CN=Globus Simple CA
If this is invalid, rerun this script
/usr/local/globus-4.0.1/setup/globus/setup-simple-ca
and enter the appropriate fields.
-------------------------------------------------------------------
The private key of the CA is stored in /home/globus/.globus/simpleCA//private/cakey.pem
The public CA certificate is stored in /home/globus/.globus/simpleCA//cacert.pem
The distribution package built for this CA is stored in
/home/globus/.globus/simpleCA//globus_simple_ca_ebb88ce5_setup-0.18.tar.gz
This file must be distributed to any host wishing to request
certificates from this CA.
CA setup complete.
The following commands will now be run to setup the security
configuration files for this CA:
$GLOBUS_LOCATION/sbin/gpt-build \
/home/globus/.globus/simpleCA//globus_simple_ca_ebb88ce5_setup-0.18.tar.gz
$GLOBUS_LOCATION/sbin/gpt-postinstall
-------------------------------------------------------------------
setup-ssl-utils: Configuring ssl-utils package
Running setup-ssl-utils-sh-scripts...
***************************************************************************
Note: To complete setup of the GSI software you need to run the
following script as root to configure your security configuration
directory:
/usr/local/globus-4.0.1/setup/globus_simple_ca_ebb88ce5_setup/setup-gsi
For further information on using the setup-gsi script, use the -help
option. The -default option sets this security configuration to be
the default, and -nonroot can be used on systems where root access is
not available.
***************************************************************************
setup-ssl-utils: Complete
globus@choate:~$
That's quite a lot of output. Here's what has happened:
globus@choate:~$ ls ~/.globus/
simpleCA
globus@choate:~$ ls ~/.globus/simpleCA/
cacert.pem globus_simple_ca_ebb88ce5_setup-0.18.tar.gz newcerts
certs grid-ca-ssl.conf private
crl index.txt serial
That's the directory where my simpleCA has been created. Now I need to make my machine trust that new CA, which I do by running the following command as root:
globus@choate:~$ exit
root@choate:~# export GLOBUS_LOCATION=/usr/local/globus-4.0.1
root@choate:~# $GLOBUS_LOCATION/setup/globus_simple_ca_ebb88ce5_setup/setup-gsi -default
setup-gsi: Configuring GSI security
Making /etc/grid-security...
mkdir /etc/grid-security
Making trusted certs directory: /etc/grid-security/certificates/
mkdir /etc/grid-security/certificates/
Installing /etc/grid-security/certificates//grid-security.conf.ebb88ce5...
Running grid-security-config...
Installing Globus CA certificate into trusted CA certificate directory...
Installing Globus CA signing policy into trusted CA certificate directory...
setup-gsi: Complete
root@choate:~# ls /etc/grid-security/
certificates globus-host-ssl.conf globus-user-ssl.conf grid-security.conf
root@choate:~# ls /etc/grid-security/certificates/
ebb88ce5.0 globus-user-ssl.conf.ebb88ce5
ebb88ce5.signing_policy grid-security.conf.ebb88ce5
globus-host-ssl.conf.ebb88ce5
Those are the configuration files that establish trust for the simpleCA for my Globus Toolkit installation. Notice that the hash value ebb88ce5 matches the hash value of my SimpleCA. These files are all explained in Security Admin. If you don't have root, you can use the -nonroot option to place the files under your GLOBUS_LOCATION instead.
Now that we've created a CA and trust it, we'll get a hostcert for the machine:
root@choate:~# source $GLOBUS_LOCATION/etc/globus-user-env.sh
root@choate:~# grid-cert-request -host `hostname`
Generating a 1024 bit RSA private key
..++++++
...................................................++++++
writing new private key to '/etc/grid-security/hostkey.pem'
...
Your certificate will be mailed to you within two working days.
If you receive no response, contact Globus Simple CA at bacon@choate
We need to sign the certificate using our simpleCA, as globus:
root@choate:~$ su - globus
globus@choate:~$ grid-ca-sign -in /etc/grid-security/hostcert_request.pem -out hostsigned.pem
To sign the request
please enter the password for the CA key:******
The new signed certificate is at: /home/globus/.globus/simpleCA//newcerts/01.pem
Our last step is to copy that signed certificate into /etc:
globus@choate:~$ exit
root@choate:~# cp ~globus/hostsigned.pem /etc/grid-security/hostcert.pem
The hostcert and hostkey are owned by root, and will be used by the GridFTP server. Because the webservices container runs non-root, we need a certificate owned by globus. In the end, we need one host certificate/key owned by root, and one host certificate/key owned by globus. We do that by copying the files:
root@choate:/etc/grid-security# cp hostcert.pem containercert.pem
root@choate:/etc/grid-security# cp hostkey.pem containerkey.pem
root@choate:/etc/grid-security# chown globus:globus container*.pem
root@choate:/etc/grid-security# ls -l *.pem
-r-------- 1 globus globus 887 2005-11-15 07:48 containerkey.pem
-rw-r--r-- 1 globus globus 2710 2005-11-15 07:48 containercert.pem
-rw-r--r-- 1 root root 2710 2005-11-15 07:47 hostcert.pem
-rw-r--r-- 1 root root 1404 2005-11-15 07:40 hostcert_request.pem
-r-------- 1 root root 887 2005-11-15 07:40 hostkey.pem
Now we'll get a usercert for bacon. In this example I'm running tcsh, just to show that the version of globus-user-env depends on your shell:
bacon@choate :~$ setenv GLOBUS_LOCATION /usr/local/globus-4.0.1/
bacon@choate :~$ source $GLOBUS_LOCATION/etc/globus-user-env.sh
bacon@choate :~$ grid-cert-request
A certificate request and private key is being created.
You will be asked to enter a PEM pass phrase.
This pass phrase is akin to your account password,
and is used to protect your key file.
If you forget your pass phrase, you will need to
obtain a new certificate.
Generating a 1024 bit RSA private key
.........................................................++++++
.........................++++++
unable to write 'random state'
writing new private key to '/home/bacon/.globus/userkey.pem'
Enter PEM pass phrase: ****
Verifying - Enter PEM pass phrase: ****
-----
You are about to be asked to enter information that will be incorporated
into your certificate request.
What you are about to enter is what is called a Distinguished Name or a DN.
There are quite a few fields but you can leave some blank
-----
Level 0 Organization [Grid]:
Level 0 Organizational Unit [GlobusTest]:
Level 1 Organizational Unit [simpleCA-choate.mcs.anl.gov]:
Level 2 Organizational Unit [mcs.anl.gov]:
Name (e.g., John M. Smith) []:
A private key and a certificate request has been generated with the subject:
/O=Grid/OU=GlobusTest/OU=simpleCA-choate.mcs.anl.gov/OU=mcs.anl.gov/CN=Charles Bacon
If the CN=Charles Bacon is not appropriate, rerun this
script with the -force -cn "Common Name" options.
Your private key is stored in /home/bacon/.globus/userkey.pem
Your request is stored in /home/bacon/.globus/usercert_request.pem
Please e-mail the request to the Globus Simple CA bacon@choate
You may use a command similar to the following:
cat /home/bacon/.globus/usercert_request.pem | mail bacon@choate
Only use the above if this machine can send AND receive e-mail. if not, please
mail using some other method.
Your certificate will be mailed to you within two working days.
If you receive no response, contact Globus Simple CA at bacon@choate
Now I need to get that certificate request to the globus user so it can be signed, then send the signed cert back to bacon:
bacon@choate :~$ cat /home/bacon/.globus/usercert_request.pem | mail globus@choate
Please note that the point of the "mail" command is to move the request from the second machine to the first machine. I need it on the first machine because that's where SimpleCA is installed. You can use scp or some other tool to move the request over to choate. Once it is on choate, sign it as user globus:
bacon@choate :~$ exit
root@choate :~$ su - globus
globus@choate:~$ grid-ca-sign -in request.pem -out signed.pem
To sign the request
please enter the password for the CA key: ******
The new signed certificate is at: /home/globus/.globus/simpleCA//newcerts/02.pem
globus@choate:~$ cat signed.pem | mail bacon@choate
Now user bacon checks his mail and copies the cert to the proper location:
globus@choate :~$ exit
bacon@choate :~$ su - bacon
bacon@choate :~$ cp signed.pem ~/.globus/usercert.pem
bacon@choate :~$ ls -l ~/.globus/
total 12
-rw-r--r-- 1 bacon globdev 895 2005-11-15 07:57 usercert.pem
-rw-r--r-- 1 bacon globdev 1426 2005-11-15 07:51 usercert_request.pem
-r-------- 1 bacon globdev 963 2005-11-15 07:51 userkey.pem
Our last act will be to create a grid-mapfile as root for authorization:
root@choate:/etc/grid-security# vim /etc/grid-security/grid-mapfile
root@choate:/etc/grid-security# cat /etc/grid-security/grid-mapfile
"/O=Grid/OU=GlobusTest/OU=simpleCA-choate.mcs.anl.gov/OU=mcs.anl.gov/CN=Charles Bacon" bacon
[Note]
Note
The globus user doesn't need a user certificate! It's a dummy account that we're using to own the GLOBUS_LOCATION. When it starts the container, it will use the containercert. Only real people need user certs.
2.4. Set up GridFTP
Now that we have our secure credentials in place, we can start a service. This setup comes from the GridFTP Admin Guide.
root@choate:/etc/grid-security# vim /etc/xinetd.d/gridftp
root@choate:/etc/grid-security# cat /etc/xinetd.d/gridftp
service gsiftp
{
instances = 100
socket_type = stream
wait = no
user = root
env += GLOBUS_LOCATION=/usr/local/globus-4.0.1
env += LD_LIBRARY_PATH=/usr/local/globus-4.0.1/lib
server = /usr/local/globus-4.0.1/sbin/globus-gridftp-server
server_args = -i
log_on_success += DURATION
nice = 10
disable = no
}
root@choate:/etc/grid-security# vim /etc/services
root@choate:/etc/grid-security# tail /etc/services
vboxd 20012/udp
binkp 24554/tcp # binkp fidonet protocol
asp 27374/tcp # Address Search Protocol
asp 27374/udp
dircproxy 57000/tcp # Detachable IRC Proxy
tfido 60177/tcp # fidonet EMSI over telnet
fido 60179/tcp # fidonet EMSI over TCP
# Local services
gsiftp 2811/tcp
root@choate:/etc/grid-security# /etc/init.d/xinetd reload
Reloading internet superserver configuration: xinetd.
root@choate:/etc/grid-security# netstat -an | grep 2811
tcp 0 0 0.0.0.0:2811 0.0.0.0:* LISTEN
Now the gridftp server is waiting for a request, so we'll run a client and transfer a file:
bacon@choate :~$ grid-proxy-init -verify -debug
User Cert File: /home/bacon/.globus/usercert.pem
User Key File: /home/bacon/.globus/userkey.pem
Trusted CA Cert Dir: /etc/grid-security/certificates
Output File: /tmp/x509up_u1817
Your identity: /O=Grid/OU=GlobusTest/OU=simpleCA-choate.mcs.anl.gov/OU=mcs.anl.gov/CN=Charles Bacon
Enter GRID pass phrase for this identity: ****
Creating proxy .....++++++++++++
..++++++++++++
Done
Proxy Verify OK
Your proxy is valid until: Tue Nov 15 20:15:46 2005
bacon@choate :~$ globus-url-copy gsiftp://choate.mcs.anl.gov/etc/group file:///tmp/bacon.test.copy
bacon@choate :~$ diff /tmp/bacon.test.copy /etc/group
bacon@choate :~$
The globus-url-copy takes two arguments, the source and the destination. In this case we're using the gsiftp:// to indicate a GridFTP transfer from the host choate.mcs.anl.gov of the file /etc/group as the source. The destination is just going to be a file on the local system under /tmp/bacon.test.copy.
Okay, so the GridFTP server works. If you had trouble, start with the GridFTP Troubleshooting guide. If the trouble is with your certificates, check the security troubleshooting. Now we can move on to starting the webservices container.
2.5. Starting the webservices container
Now we'll setup an /etc/init.d entry for the webservices container. You can find more details about the container at Container Admin Guide.
globus@choate:~$ vim $GLOBUS_LOCATION/start-stop
globus@choate:~$ cat $GLOBUS_LOCATION/start-stop
#! /bin/sh
set -e
export GLOBUS_LOCATION=/usr/local/globus-4.0.1
export JAVA_HOME=/opt/java
export ANT_HOME=/opt/ant
export GLOBUS_OPTIONS="-Xms256M -Xmx512M"
. $GLOBUS_LOCATION/etc/globus-user-env.sh
cd $GLOBUS_LOCATION
case "$1" in
start)
$GLOBUS_LOCATION/sbin/globus-start-container-detached -p 8443
;;
stop)
$GLOBUS_LOCATION/sbin/globus-stop-container-detached
;;
*)
echo "Usage: globus {start|stop}" >&2
exit 1
;;
esac
exit 0
globus@choate:~$ chmod +x $GLOBUS_LOCATION/start-stop
Now, as root, we'll create an /etc/init.d script to call the globus user's start-stop script:
root@choate:~# vim /etc/init.d/globus-4.0.1
root@choate:~# cat /etc/init.d/globus-4.0.1
#!/bin/sh -e
case "$1" in
start)
su - globus /usr/local/globus-4.0.1/start-stop start
;;
stop)
su - globus /usr/local/globus-4.0.1/start-stop stop
;;
restart)
$0 stop
sleep 1
$0 start
;;
*)
printf "Usage: $0 {start|stop|restart}\n" >&2
exit 1
;;
esac
exit 0
root@choate:~# chmod +x /etc/init.d/globus-4.0.1
root@choate:~# /etc/init.d/globus-4.0.1 start
Starting Globus container. PID: 29985
root@choate:~# cat /usr/local/globus-4.0.1/var/container.log
2005-11-15 08:48:00,886 ERROR service.ReliableFileTransferImpl [main,:68]
Unable to setup database driver with pooling.A connection error has occurred:
FATAL: no pg_hba.conf entry for host "140.221.8.31", user "globus",
database "rftDatabase", SSL off
2005-11-15 08:48:02,183 WARN service.ReliableFileTransferHome [main,initialize:97]
All RFT requests will fail and all GRAM jobs that require file staging will fail.
A connection error has occurred: FATAL: no pg_hba.conf entry for host
"140.221.8.31", user "globus", database "rftDatabase", SSL off
Starting SOAP server at: https://140.221.8.31:8443/wsrf/services/
With the following services:
[1]: https://140.221.8.31:8443/wsrf/services/TriggerFactoryService
[2]: https://140.221.8.31:8443/wsrf/services/DelegationTestService
[3]: https://140.221.8.31:8443/wsrf/services/SecureCounterService
[4]: https://140.221.8.31:8443/wsrf/services/IndexServiceEntry
[5]: https://140.221.8.31:8443/wsrf/services/DelegationService
[6]: https://140.221.8.31:8443/wsrf/services/InMemoryServiceGroupFactory
[7]: https://140.221.8.31:8443/wsrf/services/mds/test/execsource/IndexService
[8]: https://140.221.8.31:8443/wsrf/services/mds/test/subsource/IndexService
[9]: https://140.221.8.31:8443/wsrf/services/SubscriptionManagerService
[10]: https://140.221.8.31:8443/wsrf/services/TestServiceWrongWSDL
[11]: https://140.221.8.31:8443/wsrf/services/SampleAuthzService
[12]: https://140.221.8.31:8443/wsrf/services/WidgetNotificationService
[13]: https://140.221.8.31:8443/wsrf/services/AdminService
[14]: https://140.221.8.31:8443/wsrf/services/DefaultIndexServiceEntry
[15]: https://140.221.8.31:8443/wsrf/services/CounterService
[16]: https://140.221.8.31:8443/wsrf/services/TestService
[17]: https://140.221.8.31:8443/wsrf/services/InMemoryServiceGroup
[18]: https://140.221.8.31:8443/wsrf/services/SecurityTestService
[19]: https://140.221.8.31:8443/wsrf/services/ContainerRegistryEntryService
[20]: https://140.221.8.31:8443/wsrf/services/NotificationConsumerFactoryService
[21]: https://140.221.8.31:8443/wsrf/services/TestServiceRequest
[22]: https://140.221.8.31:8443/wsrf/services/IndexFactoryService
[23]: https://140.221.8.31:8443/wsrf/services/ReliableFileTransferService
[24]: https://140.221.8.31:8443/wsrf/services/mds/test/subsource/IndexServiceEntry
[25]: https://140.221.8.31:8443/wsrf/services/Version
[26]: https://140.221.8.31:8443/wsrf/services/NotificationConsumerService
[27]: https://140.221.8.31:8443/wsrf/services/IndexService
[28]: https://140.221.8.31:8443/wsrf/services/NotificationTestService
[29]: https://140.221.8.31:8443/wsrf/services/ReliableFileTransferFactoryService
[30]: https://140.221.8.31:8443/wsrf/services/DefaultTriggerServiceEntry
[31]: https://140.221.8.31:8443/wsrf/services/TriggerServiceEntry
[32]: https://140.221.8.31:8443/wsrf/services/PersistenceTestSubscriptionManager
[33]: https://140.221.8.31:8443/wsrf/services/mds/test/execsource/IndexServiceEntry
[34]: https://140.221.8.31:8443/wsrf/services/DefaultTriggerService
[35]: https://140.221.8.31:8443/wsrf/services/TriggerService
[36]: https://140.221.8.31:8443/wsrf/services/gsi/AuthenticationService
[37]: https://140.221.8.31:8443/wsrf/services/TestRPCService
[38]: https://140.221.8.31:8443/wsrf/services/ManagedMultiJobService
[39]: https://140.221.8.31:8443/wsrf/services/RendezvousFactoryService
[40]: https://140.221.8.31:8443/wsrf/services/WidgetService
[41]: https://140.221.8.31:8443/wsrf/services/ManagementService
[42]: https://140.221.8.31:8443/wsrf/services/ManagedExecutableJobService
[43]: https://140.221.8.31:8443/wsrf/services/InMemoryServiceGroupEntry
[44]: https://140.221.8.31:8443/wsrf/services/AuthzCalloutTestService
[45]: https://140.221.8.31:8443/wsrf/services/DelegationFactoryService
[46]: https://140.221.8.31:8443/wsrf/services/DefaultIndexService
[47]: https://140.221.8.31:8443/wsrf/services/ShutdownService
[48]: https://140.221.8.31:8443/wsrf/services/ContainerRegistryService
[49]: https://140.221.8.31:8443/wsrf/services/TestAuthzService
[50]: https://140.221.8.31:8443/wsrf/services/CASService
[51]: https://140.221.8.31:8443/wsrf/services/ManagedJobFactoryService
2005-11-15 08:48:29,063 INFO impl.DefaultIndexService [ServiceThread-10,processConfigFile:107]
Reading default registration configuration from file:
/usr/local/globus-4.0.1/etc/globus_wsrf_mds_index/hierarchy.xml
2005-11-15 08:48:31,705 ERROR impl.QueryAggregatorSource [Thread-12,pollGetMultiple:149]
Exception Getting Multiple Resource Properties from
https://140.221.8.31:8443/wsrf/services/ReliableFileTransferFactoryService:
java.rmi.RemoteException: Failed to serialize resource property
org.globus.transfer.reliable.service.factory.TotalNumberOfBytesTransferred@e8eeca;
nested exception is:
org.apache.commons.dbcp.DbcpException: A connection error has occurred:
FATAL: no pg_hba.conf entry for host "140.221.8.31", user "globus",
database "rftDatabase", SSL off
1
The RFT warnings are expected right now because we haven't setup our database yet. Otherwise, things look good.
2
140.221.8.31 is my IP address. Some people following the quickstart may see "127.0.0.1" here. You need to fix that! Edit $GLOBUS_LOCATION/etc/globus_wsrf_core/server-config.wsdd and client-server-config.wsdd, add a line reading 140.221.8.32" /> under the section. For instance:
You can also use this to select the interface to publish for a multi-homed host. See Global Configuration for more container config options.
At this point, we can use one of the sample clients/services to interact with the container:
choate % setenv JAVA_HOME /usr/java/j2sdk1.4.2_10/
choate % setenv ANT_HOME /usr/local/apache-ant-1.6.5/
choate % setenv PATH $ANT_HOME/bin:$JAVA_HOME/bin:$PATH
choate % counter-client -s https://choate.mcs.anl.gov:8443/wsrf/services/CounterService
Got notification with value: 3
Counter has value: 3
Got notification with value: 13
Whenever you see me testing against "choate.mcs.anl.gov" in this document, use your own fully qualified hostname. Connections to choate will timeout because the host is behind a firewall.
That is the expected output, so it looks like the container is up and running. Next we'll configure a database for RFT to get rid of that pesky warning, and so we can reliably transfer files using GridFTP!
2.6. Configuring RFT
Following the instructions at RFT Admin, we'll first configure the system to allow TCP/IP connections to postgres, as well as adding a trust entry for our current host. More recent versions of postgres have deprecated the "-i" option. For version 8 and newer, instead set "listen_addresses = '*'" in the postgres configuration file.
root@choate:~# vim /var/lib/psql/data/pg_hba.conf
root@choate:~# grep rftDatabase /etc/postgresql/pg_hba.conf
host rftDatabase "globus" "140.221.8.31" 255.255.255.255 md5
root@choate:~# /etc/init.d/postgresql restart
Stopping PostgreSQL database server: postmaster.
Starting PostgreSQL database server: postmaster.
root@choate:~# su postgres -c "createuser -P globus"
Enter password for new user: *****
Enter it again: *****
Shall the new user be allowed to create databases? (y/n) y
Shall the new user be allowed to create more new users? (y/n) n
CREATE USER
[Note]
Note
This is one of the most system-dependent steps of this quickstart. Your pg_hba.conf and postmaster.conf files may be located in a different directory. Please consult your vendor's notes for details.
Now the globus user can create the rftDatabase:
globus@choate:~$ createdb rftDatabase
CREATE DATABASE
globus@choate:~$ psql -d rftDatabase -f $GLOBUS_LOCATION/share/globus_wsrf_rft/rft_schema.sql
psql:/usr/local/globus-4.0.1/share/globus_wsrf_rft/rft_schema.sql:6: NOTICE:
CREATE TABLE / PRIMARY KEY will create implicit index "requestid_pkey" for table "requestid"
CREATE TABLE
psql:/usr/local/globus-4.0.1/share/globus_wsrf_rft/rft_schema.sql:11: NOTICE:
CREATE TABLE / PRIMARY KEY will create implicit index "transferid_pkey" for table "transferid"
CREATE TABLE
psql:/usr/local/globus-4.0.1/share/globus_wsrf_rft/rft_schema.sql:30: NOTICE:
CREATE TABLE / PRIMARY KEY will create implicit index "request_pkey" for table "request"
CREATE TABLE
psql:/usr/local/globus-4.0.1/share/globus_wsrf_rft/rft_schema.sql:65: NOTICE:
CREATE TABLE / PRIMARY KEY will create implicit index "transfer_pkey" for table "transfer"
CREATE TABLE
CREATE TABLE
CREATE TABLE
CREATE INDEX
globus@choate:~$ vim $GLOBUS_LOCATION/etc/globus_wsrf_rft/jndi-config.xml
globus@choate:~$ grep -C 3 password $GLOBUS_LOCATION/etc/globus_wsrf_rft/jndi-config.xml
password
*****
I have created the database, loaded the RFT schema, and changed the password in the jndi-config.xml file. If your database isn't owned by the same user as the container, you will also need to change the username parameter in the jndi-config.xml. In this example, we installed as globus and made the database as globus, so I only changed the password.
The database is setup, so we restart the container to load the new RFT configuration:
root@choate:~# /etc/init.d/globus-4.0.1 restart
Stopping Globus container. PID: 29985
Starting Globus container. PID: 8620
root@choate:~# head /usr/local/globus-4.0.1/var/container.log
Starting SOAP server at: https://140.221.8.31:8443/wsrf/services/
With the following services:
[1]: https://140.221.8.31:8443/wsrf/services/TriggerFactoryService
[2]: https://140.221.8.31:8443/wsrf/services/DelegationTestService
[3]: https://140.221.8.31:8443/wsrf/services/SecureCounterService
[4]: https://140.221.8.31:8443/wsrf/services/IndexServiceEntry
[5]: https://140.221.8.31:8443/wsrf/services/DelegationService
[6]: https://140.221.8.31:8443/wsrf/services/InMemoryServiceGroupFactory
[7]: https://140.221.8.31:8443/wsrf/services/mds/test/execsource/IndexService
...
Great, we got rid of the warning. Now let's try an RFT transfer to make sure the service is really working:
bacon@choate :~$ cp /usr/local/globus-4.0.1/share/globus_wsrf_rft_test/transfer.xfr /tmp/rft.xfr
bacon@choate :~$ vim /tmp/rft.xfr
bacon@choate :~$ cat /tmp/rft.xfr
true
16000
16000
false
1
true
1
null
null
false
10
gsiftp://choate.mcs.anl.gov:2811/etc/group
gsiftp://choate.mcs.anl.gov:2811/tmp/rftTest_Done.tmp
bacon@choate :~$ rft -h choate.mcs.anl.gov -f /tmp/rft.xfr
Number of transfers in this request: 1
Subscribed for overall status
Termination time to set: 60 minutes
Overall status of transfer:
Finished/Active/Failed/Retrying/Pending
0/1/0/0/0
Overall status of transfer:
Finished/Active/Failed/Retrying/Pending
1/0/0/0/0
All Transfers are completed
bacon@choate :~$ diff /etc/group /tmp/rftTest_Done.tmp
bacon@choate :~$
RFT did its job, starting up a reliable transfer and notifying us of the status and results.
2.7. Setting up WS GRAM
Now that we have GridFTP and RFT working, we can setup GRAM for resource management. First we have to setup sudo so the globus user can start jobs as a different user. For reference, you can see the GRAM Admin Guide.
root@choate:~# visudo
root@choate:~# cat /etc/sudoers
globus ALL=(bacon) NOPASSWD: /usr/local/globus-4.0.1/libexec/globus-gridmap-and-execute
-g /etc/grid-security/grid-mapfile /usr/local/globus-4.0.1/libexec/globus-job-manager-script.pl *
globus ALL=(bacon) NOPASSWD: /usr/local/globus-4.0.1/libexec/globus-gridmap-and-execute
-g /etc/grid-security/grid-mapfile /usr/local/globus-4.0.1/libexec/globus-gram-local-proxy-tool *
Make sure they're all on one line. I split them up in the HTML to keep the page width down. Also, if your sudoers has a line reading "requiretty", remove it. The container won't have a tty while it is running, but it needs to use sudo. With that addition, we can now run jobs:
bacon@choate :~$ globusrun-ws -submit -c /bin/true
Submitting job...Done.
Job ID: uuid:3304e3f2-55f2-11da-8b8f-00d0b7b7c0bc
Termination time: 11/16/2005 16:09 GMT
Current job state: Active
Current job state: CleanUp
Current job state: Done
Destroying job...Done.
bacon@choate :~$ echo $?
0
choate % globusrun-ws -submit -c /bin/false
Submitting job...Done.
Job ID: uuid:456b7c9a-55f2-11da-9b0d-00d0b7b7c0bc
Termination time: 11/16/2005 16:09 GMT
Current job state: Active
Current job state: CleanUp
Current job state: Done
Destroying job...Done.
bacon@choate :~$ echo $?
1
Success. Now we've got a working GRAM installation.
3. Setting up your second machine
3.1. Setting up your second machine: Prereqs
Alas, it's not much of a grid with just one machine. So let's start up on another machine and add it to this little test grid. For a change of pace, I'm going to use the binary installer on this machine. First, though, let's get some prereqs out of the way:
root@cognito:~# cd /opt
root@cognito:~# ./jdk-6u13-linux-i586.bin
root@cognito:~# mv jdk1.6.0_13 java
Next, we download from here, install ant:
root@cognito:~# cd /opt
root@cognito:~# tar xzf apache-ant-1.7.1-bin.tar.gz
root@cognito:~# mv apache-ant-1.7.1 ant
Also need to set JAVA_HOME and ANT_HOME
Add below entry in /etc/profile
export JAVA_HOME=/opt/java
export ANT_HOME=/opt/ant
export GLOBUS_LOCATION=/usr/local/globus-4.0.1
export PATH=$JAVA_HOME/bin:$ANT_HOME/bin:$GLOBUS_LOCATION/bin:$GLOBUS_LOCATION/sbin:$PATH
root@cognito:~# adduser globus
root@cognito:~# mkdir /usr/local/globus-4.0.1
root@cognito:~# chown globus:globus /usr/local/globus-4.0.1
Then, as user globus:
globus@cognito:~$ tar xzf gt4.0.8-all-source-installer.tar.gz
[Note]
Note
You might notice that I didn't install Postgres on this machine. That's because my grid can actually share the services of the RFT located on my first machine. Even if I weren't planning on that, I could add this new machine to the pg_hba.conf on the first machine and re-use the existing DB server.
3.2. Setting up your second machine: Installation
Now we can install from binaries:
globus@cognito:~/gt4.0.8-all-source-installer$ ./configure \
--prefix=/usr/local/globus-4.0.1
checking for javac... /usr/java/j2sdk1.4.2_10//bin/javac
checking for ant... /usr/local/apache-ant-1.6.5//bin/ant
configure: creating ./config.status
config.status: creating Makefile
globus@cognito:~/gt4.0.8-all-source-installer$ make
cd gpt-3.2autotools2004 && OBJECT_MODE=32 ./build_gpt
...
Binaries are much faster! This is done in less than 10 minutes.
...
tar -C /usr/local/globus-4.0.1 -xzf binary-trees/globus_wsrf_rft_test-*/*.tar.gz
tar -C /usr/local/globus-4.0.1 -xzf binary-trees/globus_rendezvous-*/*.tar.gz
echo "Your build completed successfully. Please run make install."
Your build completed successfully. Please run make install.
globus@cognito:~/gt4.0.8-all-source-installer$ make install
ln -s /usr/local/globus-4.0.1/etc/gpt/packages /usr/local/globus-4.0.1/etc/globus_packages
...
config.status: creating fork.pm
..Done
3.3. Setting up your second machine: Security
Now let's get security setup on the second machine. We're going to just add trust for the original simpleCA to this new machine, there's no need to create a new one. This is the multiple machines section of the SimpleCA guide.
Please make sure that your two machines agree on the time! These certificates have dates that tell you when they are valid. If your two machines don't agree about the time, you might get errors saying a certificate is not yet valid. If you use NTP, this won't be a problem.
globus@cognito:~$ scp choate:.globus/simpleCA/globus_simple_ca_ebb88ce5_setup-0.18.tar.gz .
globus@cognito:~$ $GLOBUS_LOCATION/sbin/gpt-build globus_simple_ca_ebb88ce5_setup-0.18.tar.gz
gpt-build ====> CHECKING BUILD DEPENDENCIES FOR globus_simple_ca_ebb88ce5_setup
gpt-build ====> Changing to /sandbox/globus/BUILD/globus_simple_ca_ebb88ce5_setup-0.18/
gpt-build ====> BUILDING globus_simple_ca_ebb88ce5_setup
gpt-build ====> Changing to /sandbox/globus/BUILD
gpt-build ====> REMOVING empty package globus_simple_ca_ebb88ce5_setup-noflavor-data
gpt-build ====> REMOVING empty package globus_simple_ca_ebb88ce5_setup-noflavor-dev
gpt-build ====> REMOVING empty package globus_simple_ca_ebb88ce5_setup-noflavor-doc
gpt-build ====> REMOVING empty package globus_simple_ca_ebb88ce5_setup-noflavor-pgm_static
gpt-build ====> REMOVING empty package globus_simple_ca_ebb88ce5_setup-noflavor-rtl
globus@cognito:~$ $GLOBUS_LOCATION/sbin/gpt-postinstall
running /usr/local/globus-4.0.1/setup/globus/./setup-ssl-utils.ebb88ce5..
[ Changing to /usr/local/globus-4.0.1/setup/globus/. ]
...
setup-ssl-utils: Complete
..Done
WARNING: The following packages were not set up correctly:
globus_simple_ca_ebb88ce5_setup-noflavor-pgm
Check the package documentation or run postinstall -verbose to see what happened
That installed the package, but the warning is letting us know that root still needs to run the setup script:
globus@cognito:~$ exit
root@cognito:~# source $GLOBUS_LOCATION/etc/globus-user-env.sh
root@cognito:~# $GLOBUS_LOCATION/setup/globus_simple_ca_ebb88ce5_setup/setup-gsi -default
setup-gsi: Configuring GSI security
Making /etc/grid-security...
mkdir /etc/grid-security
Making trusted certs directory: /etc/grid-security/certificates/
mkdir /etc/grid-security/certificates/
Installing /etc/grid-security/certificates//grid-security.conf.ebb88ce5...
Running grid-security-config...
nstalling Globus CA certificate into trusted CA certificate directory...
Installing Globus CA signing policy into trusted CA certificate directory...
setup-gsi: Complete
Now our new machine's security directory looks like our other machine:
root@cognito:~# ls /etc/grid-security/
certificates globus-host-ssl.conf globus-user-ssl.conf grid-security.conf
root@cognito:~# ls /etc/grid-security/certificates/
ebb88ce5.0 globus-user-ssl.conf.ebb88ce5
ebb88ce5.signing_policy grid-security.conf.ebb88ce5
globus-host-ssl.conf.ebb88ce5
Now we need a hostcert for the new machine:
root@cognito:~# grid-cert-request -host `hostname`
The hostname cognito does not appear to be fully qualified.
Do you wish to continue? [n] n
Aborting
...
If you receive no response, contact Globus Simple CA at bacon@choate
root@cognito:~# hostname
cognito
Uh-oh. Our hostname isn't fully qualified, which is going to cause us trouble down the road. If you have this problem, there are several possible solutions. One is to run the hostname command as root to set your FQDN as your hostname. Another possibility is that your /etc/hosts may have a short name listed for your IP address. Let's see what the problem is on cognito:
root@cognito:~# host 140.221.8.109
109.8.221.140.in-addr.arpa domain name pointer cognito.mcs.anl.gov.
If the problem had been in /etc/hosts, I would have fixed it. Here's what a good /etc/hosts line would look like:
140.221.8.109 cognito.mcs.anl.gov cognito
Since reverse lookups work okay, I will just spell out the FQDN by hand in this cert request:
root@cognito:~# grid-cert-request -host cognito.mcs.anl.gov -force
/etc/grid-security/hostcert_request.pem already exists
/etc/grid-security/hostcert.pem already exists
/etc/grid-security/hostkey.pem already exists
...
Your certificate will be mailed to you within two working days.
If you receive no response, contact Globus Simple CA at bacon@choate
The request already existed for "cognito", but the -force overwrote that request with one for "cognito.mcs.anl.gov". Now I need to copy that back to choate and sign it:
root@cognito:~# scp /etc/grid-security/hostcert_request.pem globus@choate:/home/globus
Now I sign it as globus on choate. Remember, that's where I installed the SimpleCA, so that's where I sign it:
globus@choate:/tmp$ grid-ca-sign -in hostcert_request.pem -out out.pem
To sign the request
please enter the password for the CA key:
The new signed certificate is at: /home/globus/.globus/simpleCA//newcerts/03.pem
globus@choate:/tmp$ scp /tmp/out.pem root@cognito:/root/
Root checks his email, then saves the signed cert:
root@cognito:~# cp out.pem /etc/grid-security/hostcert.pem
root@cognito:~# cd /etc/grid-security
root@cognito:/etc/grid-security# cp hostcert.pem containercert.pem
root@cognito:/etc/grid-security# cp hostkey.pem containerkey.pem
root@cognito:/etc/grid-security# chown globus:globus container*.pem
root@cognito:/etc/grid-security# ls -l *.pem
-rw-r--r-- 1 globus globus 2711 2005-11-15 11:14 containercert.pem
-r-------- 1 globus globus 887 2005-11-15 11:15 containerkey.pem
-rw-r--r-- 1 root root 2711 2005-11-15 11:14 hostcert.pem
-rw-r--r-- 1 root root 1405 2005-11-15 11:09 hostcert_request.pem
-r-------- 1 root root 887 2005-11-15 11:09 hostkey.pem
There. Now cognito is setup with host and container certs, and it trusts the CA of my grid. The last step for root is to create a grid-mapfile for myself again:
root@cognito:/etc/grid-security# vim grid-mapfile
root@cognito:/etc/grid-security# cat grid-mapfile
"/O=Grid/OU=GlobusTest/OU=simpleCA-choate.mcs.anl.gov/OU=mcs.anl.gov/CN=Charles Bacon" bacon
Also, user bacon should get a local copy of the usercert:
root@cognito:/etc/grid-security# su – bacon
cognito % scp -r choate:.globus .
Password:
usercert.pem 100% 895 0.9KB/s 00:00
usercert_request.pem 100% 1426 1.4KB/s 00:00
userkey.pem 100% 963 0.9KB/s 00:00
3.4. Setting up your second machine: GridFTP
GridFTP setup on the second machine is identical to the first. I'll just list the commands here, see Section 2.4, “Set up GridFTP” for the file contents, or just copy them from the first machine.
root@cognito:/etc/grid-security# vim /etc/xinetd.d/gridftp
root@cognito:/etc/grid-security# vim /etc/services
root@cognito:/etc/grid-security# /etc/init.d/xinetd reload
Reloading internet superserver configuration: xinetd.
Now we can test it:
root@cognito:/etc/grid-security# su - bacon
bacon@cognito:~$ source $GLOBUS_LOCATION/etc/globus-user-env.sh
bacon@cognito:~$ grid-proxy-init -verify -debug
User Cert File: /home/bacon/.globus/usercert.pem
User Key File: /home/bacon/.globus/userkey.pem
Trusted CA Cert Dir: /etc/grid-security/certificates
Output File: /tmp/x509up_u1817
Your identity: /O=Grid/OU=GlobusTest/OU=simpleCA-choate.mcs.anl.gov/OU=mcs.anl.gov/CN=Charles Bacon
Enter GRID pass phrase for this identity:
Creating proxy ...........++++++++++++
........++++++++++++
Done
Proxy Verify OK
Your proxy is valid until: Tue Nov 15 23:33:37 2005
bacon@cognito:~$ globus-url-copy gsiftp://cognito.mcs.anl.gov/etc/group gsiftp://choate.mcs.anl.gov/tmp/from-cognito
That was a slightly fancier test than I ran on choate. In this case, I did a third-party transfer between two GridFTP servers. It worked, so I have the local and remote security setup correctly.
3.5. Setting up your second machine: Webservices
Setting up the container on the second machine is a lot like the first. I'll list the commands here. See Section 2.5, “Starting the webservices container”, or you can just copy the files from the first machine. First globus creates the start-stop script:
globus@cognito:~$ vim $GLOBUS_LOCATION/start-stop
globus@cognito:~$ chmod +x $GLOBUS_LOCATION/start-stop
Then root creates an init.d script to call it:
root@cognito:~# vim /etc/init.d/globus-4.0.1
root@cognito:~# chmod +x /etc/init.d/globus-4.0.1
root@cognito:/etc/grid-security# /etc/init.d/globus-4.0.1 start
Starting Globus container. PID: 17269
3.6. Setting up your second machine: WS GRAM
For a change of pace, we'll setup GRAM first on the second machine, even though we haven't got a working RFT locally. As with last time, we'll need to setup the sudoers. See Section 2.7, “Setting up WS GRAM” for the sudo contents, or copy the sudoers from the first machine. If you just copy the file, please make sure that you have sudo installed already, and that the permissions are 440.
root@cognito:/etc/grid-security# visudo
Now we can submit a staging job:
bacon@cognito:~$ vim a.rsl
bacon@cognito:~$ cat a.rsl
bacon@cognito:~$ cat a.rsl
my_echo
${GLOBUS_USER_HOME}
Hello
World!
${GLOBUS_USER_HOME}/stdout
${GLOBUS_USER_HOME}/stderr
gsiftp://cognito.mcs.anl.gov:2811/bin/echo
file:///${GLOBUS_USER_HOME}/my_echo
file:///${GLOBUS_USER_HOME}/my_echo
bacon@cognito:~$ globusrun-ws -submit -S -f a.rsl
Delegating user credentials...Done.
Submitting job...Done.
Job ID: uuid:6732f346-5604-11da-9951-0002b3882c16
Termination time: 11/16/2005 18:19 GMT
Current job state: StageIn
Current job state: Active
Current job state: CleanUp
Current job state: Done
Destroying job...Done.
Cleaning up any delegated credentials...Done.
bacon@cognito:~$ cat ~/stdout
Hello World!
bacon@cognito:~$ ls ~/my_echo
ls: /home/bacon/my_echo: No such file or directory
This is an example of a staging job. It copies the /bin/echo command from cognito to my home directory and names it my_echo. Then it runs it with some arguments, and captures the stderr/stdout. One of the neat features here is that it used the RFT service on choate to transfer the file via the GridFTP server on cognito. It's starting to look like a Grid!
If you got an "invalid executable: my_echo" error, make sure you staged the echo command to the machine where you're executing the job. One way to get this error is by running this on cognito, but staging the file to choate instead. The stageIn will work, but the job will fail because you staged to the wrong host.
Also, this won't work if your cognito and choate have different processor architectures. For instance, you can't run an ia64 binary on an ia32 computer. In that case, you could try staging in a shell script instead.
You can get other examples of GRAM RSL files from GRAM usage scenarios.
Also, you can submit from one machine to another using the -F (factory) option. For instance, to submit from cognito to choate:
bacon@cognito:~$ globusrun-ws -F choate -submit -c /bin/true
Submitting job...Done.
Job ID: uuid:0efba320-4780-11dc-bd6b-0007e9d811ce
Termination time: 08/11/2007 20:27 GMT
Current job state: Active
Current job state: CleanUp
Current job state: Done
Destroying job...Done.
Likewise, you could login to choate and submit a job to cognito.
Thursday, April 16, 2009
Network monitoring with Nagios and OpenBSD
1. Introduction
So our OpenBSD-based network now includes redundant firewalls, domain name servers, a mail gateway and a web proxy cache. All the services provided by these machines are particularly critical and can't afford even minimal downtime. Redundancy may give us the time to recover a failure before having angry users trying to knock down our door, but it doesn't free us from the responsibility to detect and solve ongoing problems.
To put it short, it's time to think about monitoring our network! And the following are the perfect ingredients for implementing a full-featured, secure and reliable network monitoring system:
- OpenBSD
- the operating system for the security paranoid, with
only two remote holes in the default install, in more than 10 years!
; - Nagios
- the
leader and industry standard in enterprise system, network, and application monitoring
; - Apache
- the
secure, efficient and extensible server that provides HTTP services in sync with the current HTTP standards
.
My pick goes to Nagios for its ease of use, flexibility and extensibility. It also features a very clean and straightforward design, as it is structured into three basic building blocks:
- a daemon process, running periodic checks on specific hosts and services and managing notifications when problems arise;
- an optional web interface, to access current status information, historical logs and reports via a simple web browser;
- a set of external plugins, i.e. the (possibly custom) scripts executed by the daemon process to actually perform the checks and send out notifications.
Furthermore, these basic components can be easily extended with external modules, making it easy for Nagios to meet even your most demanding needs! Therefore, after the installation and configuration of the Nagios' core components, we will take a brief look at some of its most popular and useful addons:
- NRPE, the Nagios Remote Plugin Executor, which allows you to execute local plugins on remote hosts;
- NSCA, the Nagios Service Check Acceptor, which processes passive service check results submitted by clients to the Nagios server;
- NagVis, the Nagios Visualization Addon, which allows you to deeply customize how Nagios data is displayed;
A good knowledge of OpenBSD is assumed, since we won't delve into system management topics such as base configuration or packages/ports installation.
2. Installation and base configuration
Before delving straight into the details of Nagios installation and configuration, let's take a brief look at the layout of the network that we're going to monitor. It's a very simple and small network, made up of:
- a LAN (172.16.0.0/24), containing clients and servers not accessible from the public Internet (e.g. file server, DHCP server);
- a DMZ (172.16.240.0/24), containing the servers that must access the Internet (e.g. mail, web and proxy servers);
- a router, in a small subnet (172.16.250.0/24), connecting the DMZ to the Internet.
Our network monitoring system is a security-critical host and won't need to directly access the Internet, so it will perfectly fit in the internal LAN.
The OpenBSD installation procedure is documented in full detail in the official FAQ, so we won't linger on it here. Nagios doesn't have particular requirements and a standard OpenBSD installation will do just fine: according to the documentation, Nagios makes do with just a machine running Linux (or UNIX variant)
. That doesn't sound so fussy, does it?
2.1 Packages installation
Nagios installation only requires adding a few packages:
- libltdl-x.x.tgz
- libiconv-x.x.x.tgz
- gettext-x.x.x.tgz
- nagios-plugins-x.x.tgz
- nagios-x.x-chroot.tgz
- nagios-web-x.x-chroot.tgz
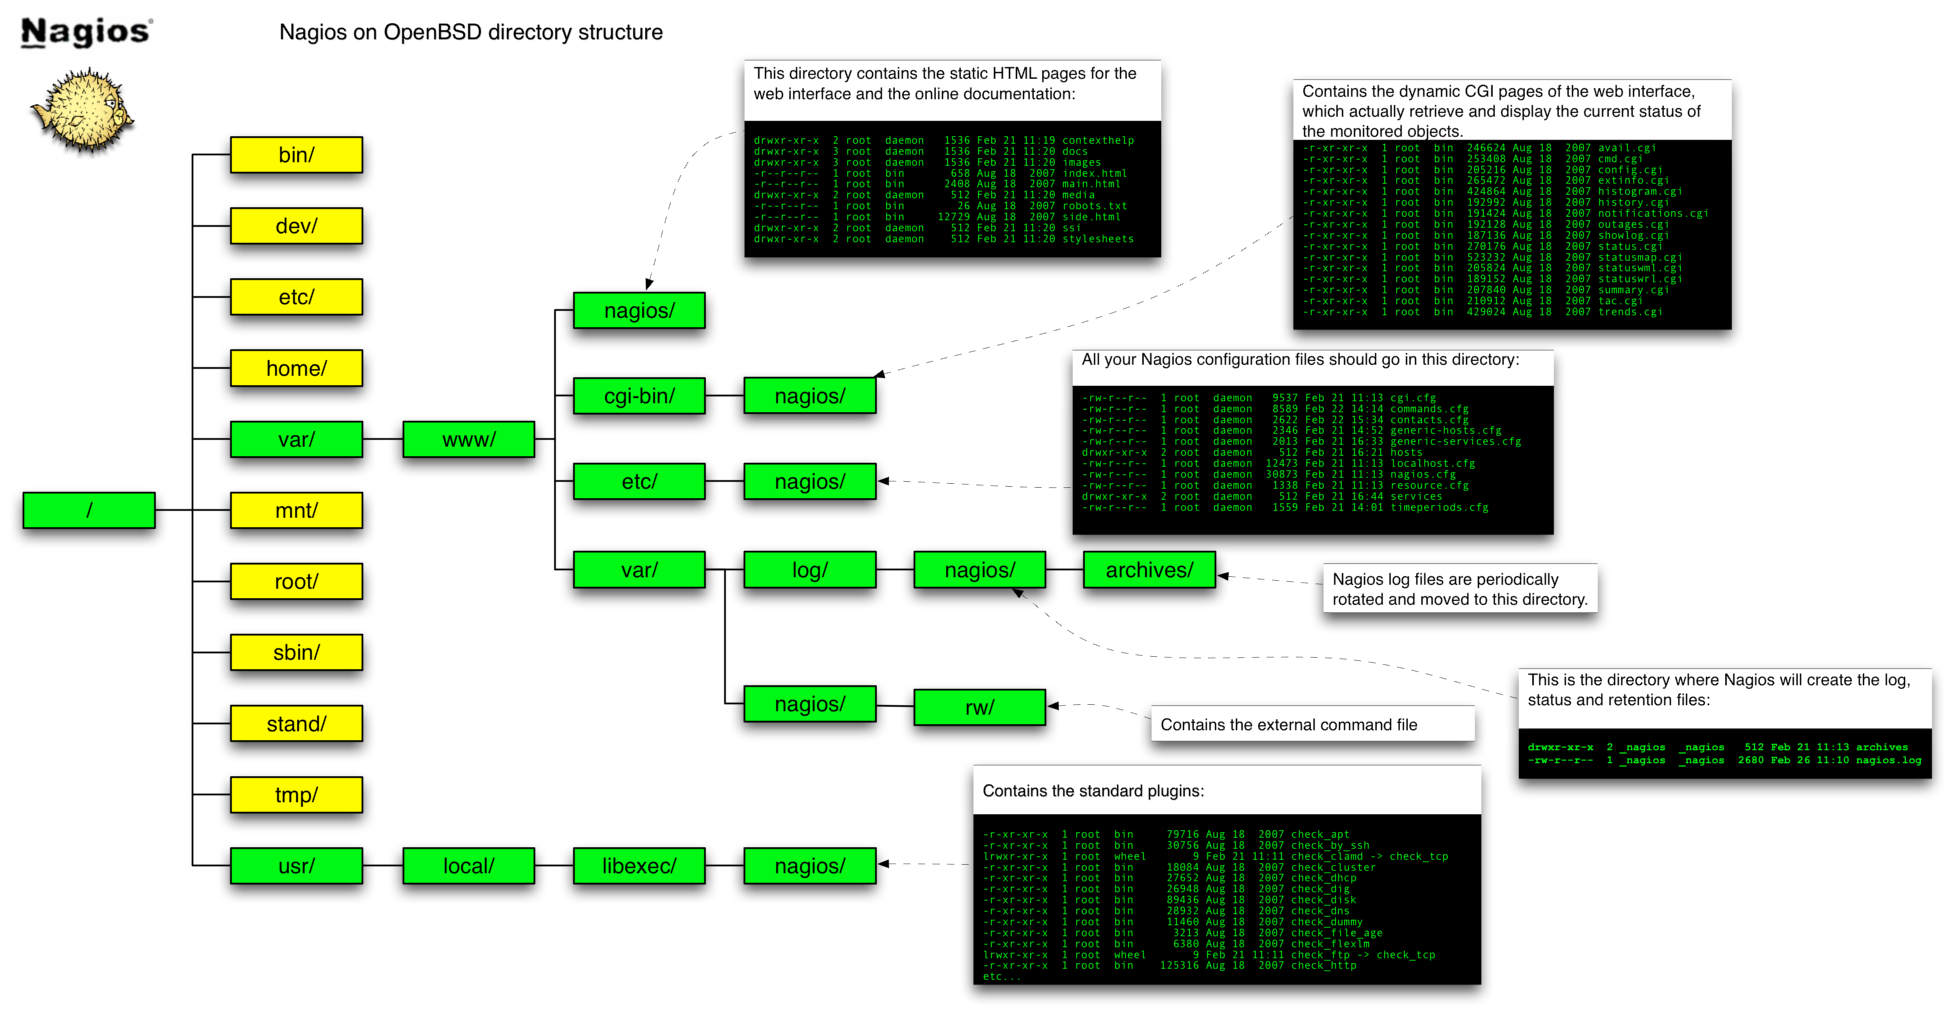
The installation procedure will automatically create the user and group that the monitoring daemon will drop its privileges to (_nagios). The chroot flavor will install Nagios in a way suited for chrooted httpd(8), i.e. with the CGIs statically linked and all the configuration and log files stored inside the /var/www directory. By the way, Nagios has a particular directory structure that you will have to become familiar with:
- /var/www/nagios/
- this directory contains the static HTML pages for the web interface and the online documentation;
- /var/www/cgi-bin/nagios/
- contains the dynamic CGI pages of the web interface, which actually retrieve and display the current status of the monitored objects;
- /var/www/etc/nagios/
- you should put all your Nagios configuration files in this directory: we will examine them one by one in a moment;
- /var/www/var/log/nagios/
- this is the directory where Nagios will create the log, status and retention files;
- /var/www/var/log/nagios/archives/
- Nagios log files are periodically rotated and moved to this directory;
- /var/www/var/nagios/rw/
- contains the external command file;
- /usr/local/libexec/nagios/
- contains the standard plugins.
As a reference, below is a visual representation of the directory structure of Nagios, kindly submitted by Bren Smith (click here for a larger view).
2.2 Configuration overview
Nagios configuration may look overly complicated at first glance; even the documentation warns that Nagios is quite powerful and flexible, but it can take a lot of work to get it configured just the way you'd like
. Anyway, don't despair! Once you've figured out the underlying logic of its "object-oriented" configuration, you will appreciate Nagios' flexibility and clean design. For the first tests, you can start by tweaking the sample configuration files contained in the /usr/local/share/examples/nagios/ directory, customizing them to your needs.
The syntax of Nagios configuration files follows a few basic rules:
- comments start with a "#" character and span to the end of the line;
- variable names must begin at the start of the line (i.e. no indentation allowed);
- variable names are case sensitive;
- no spaces are allowed around the "=" sign.
Configuration involves setting several parameters concerning the monitoring daemon, the CGIs and, of course, the hosts and services you want to monitor. All this information is spread among multiple files: we will now examine them one by one.
2.2.1 The main configuration file
The overall behaviour of the Nagios daemon is determined by the directives included in the main configuration file, /var/www/etc/nagios/nagios.cfg. Though this file contains several dozens of parameters, for most of them the default value is the most reasonable option and you will probably want to care about only very few of them (usually cfg_file, cfg_dir and admin_email). In any case, you can find a detailed description of each and every parameter in the official documentation.
/var/www/etc/nagios/nagios.cfg
# Path to main log file and log archive directory. All pathnames are relative
# to the chroot directory '/var/www/'
log_file=/var/log/nagios/nagios.log
log_archive_path=/var/log/nagios/archives

# Paths to files managed internally by the application
object_cache_file=/var/nagios/objects.cache
precached_object_file=/var/nagios/objects.precache
status_file=/var/nagios/status.dat
state_retention_file=/var/nagios/retention.dat
command_file=/var/nagios/rw/nagios.cmd
lock_file=/var/run/nagios/nagios.pid
temp_file=/var/nagios/nagios.tmp
temp_path=/tmp
check_result_path=/var/spool/nagios

# Object definitions (see next chapter) can be split across multiple files.
# You may either list files individually (using the 'cfg_file' parameter) or
# group them into directories (using the 'cfg_dir' parameter). In the latter
# case, Nagios will process all files with a '.cfg' extension found in the
# specified directories and their subdirectories
cfg_file=/etc/nagios/timeperiods.cfg
cfg_file=/etc/nagios/contacts.cfg
cfg_file=/etc/nagios/commands.cfg
cfg_file=/etc/nagios/generic-hosts.cfg
cfg_file=/etc/nagios/generic-services.cfg
cfg_dir=/etc/nagios/hosts
cfg_dir=/etc/nagios/services

# Path to the resource file, containing user-defined macros (see below). You can
# specify more than one resource file using multiple 'resource_file' statements
resource_file=/etc/nagios/resource.cfg

# User and group the Nagios process will run as
nagios_user=_nagios
nagios_group=_nagios

# Email address and pager number for the administrator of the local machine
admin_email=nagios@kernel-panic.it
admin_pager=xxx-xxx-xxxx

# Date format (available options: us, euro, iso8601 or strict-iso8601)
date_format=euro

# Enable checks, notifications and event handlers. Passive checks allow external
# applications to submit check results to Nagios. Event handlers are optional
# commands that are executed whenever a host or service state change occurs
execute_service_checks=1
accept_passive_service_checks=1
execute_host_checks=1
accept_passive_host_checks=1
enable_notifications=1
enable_event_handlers=1

# Checks freshness options. Enabling these options will ensure that passive
# checks are always up-to-date
check_service_freshness=1
service_freshness_check_interval=60
check_host_freshness=0
host_freshness_check_interval=60
additional_freshness_latency=15

# External commands allow the web interface and external applications (such as
# NSCA) to issue commands to Nagios. With a check interval of '-1', Nagios will
# check for external commands as often as possible
check_external_commands=1
command_check_interval=-1
external_command_buffer_slots=4096

# Various logging options
log_rotation_method=d
use_syslog=1
log_notifications=1
log_service_retries=1
log_host_retries=1
log_event_handlers=1
log_initial_states=0
log_external_commands=1
log_passive_checks=1

# Enable retention of state information between program restarts (refer to
# documentation for details)
retain_state_information=1
retention_update_interval=60
use_retained_program_state=1
use_retained_scheduling_info=0

# State flapping detection options (refer to documentation for details)
enable_flap_detection=0
low_service_flap_threshold=5.0
high_service_flap_threshold=20.0
low_host_flap_threshold=5.0
high_host_flap_threshold=20.0

# Miscellaneous tuning, performance and security options (refer to
# documentation for details)
interval_length=60
service_inter_check_delay_method=s
max_service_check_spread=30
service_interleave_factor=s
host_inter_check_delay_method=s
max_host_check_spread=30
max_concurrent_checks=0
check_result_reaper_frequency=10
max_check_result_reaper_time=30
max_check_result_file_age=3600
cached_host_check_horizon=15
cached_service_check_horizon=15
enable_predictive_host_dependency_checks=1
enable_predictive_service_dependency_checks=1
soft_state_dependencies=0
auto_reschedule_checks=0
auto_rescheduling_interval=30
auto_rescheduling_window=180
status_update_interval=15
event_broker_options=-1

sleep_time=0.25
service_check_timeout=60
host_check_timeout=30
event_handler_timeout=30
notification_timeout=30
ocsp_timeout=5
perfdata_timeout=5

use_aggressive_host_checking=0
process_performance_data=0
obsess_over_services=0
obsess_over_hosts=0
translate_passive_host_checks=0
passive_host_checks_are_soft=0

check_for_orphaned_services=0
check_for_orphaned_hosts=1

p1_file=/usr/local/bin/p1.pl
enable_embedded_perl=1
use_embedded_perl_implicitly=1

illegal_object_name_chars=`~!$%^&*|'"<>?,()=
illegal_macro_output_chars=`~$&|'"<>
use_regexp_matching=0
use_true_regexp_matching=0
daemon_dumps_core=0
use_large_installation_tweaks=0
enable_environment_macros=1

# Debug options
debug_level=0
debug_verbosity=1
debug_file=/var/nagios/nagios.debug
max_debug_file_size=1000000
2.2.2 The resource file
The resource file allows you to assign values to the user-definable macros "$USERn$" (where n is a number between 1 and 32 inclusive). Basically, in Nagios, macros are variables (starting and ending with a dollar sign, "$") that you can insert into command definitions and that will get expanded to the appropriate value immediately prior to the execution of the command. User-defined macros (and the several other macros Nagios makes available) allow you to keep command definitions generic and simple (see the next chapter for some examples).
User-defined macros are normally used to store recurring items in command definitions (like directory paths) and sensitive information (like usernames and passwords). It is recommended that you set restrictive permissions (600) on the resource file(s) in order to keep sensitive information protected.
/var/www/etc/nagios/resource.cfg
# Set $USER1$ to be the path to the plugins
$USER1$=/usr/local/libexec/nagios

# MySQL username and password
$USER2$=root
$USER3$=password
The next step is configuring object data, which is probably the trickiest part of the configuration. We will therefore devote the next chapter entirely to this topic.
3.0 Object data configuration
So now it's time to tell Nagios what to keep tabs on. Therefore, we must supply it with information about:
- when and how to perform checks and send out notifications;
- whom to notify;
- which hosts and services to monitor.
All this information is represented by means of objects, which are defined by a set of "define" statements, enclosed in curly braces and containing a variable number of newline-separated directives, in keyword/value form. Keywords are separated from values by whitespace and multiple values can be separated by commas; indentation within statements is allowed.
To recap, the basic syntax of an object declaration can be represented as follows:
define object {
  keyword-1     value-1
  keyword-2     value-2,value-3,...
  [...]
  keyword-n     value-n
}
Object definitions can be split into any number of files: just remember to list them all in the main configuration file by using the cfg_file and/or cfg_dir directives.
3.1 Timeperiod definition
The timeperiod statement allows you to specify, for each day of the week, one or more time slots in which to run certain checks and/or notify certain people. Time intervals can't span across midnight and excluded days are simply omitted.
In the following example, all the timeperiod definitions are grouped together in a file named timeperiods.cfg stored in the /var/www/etc/nagios/ directory.
/var/www/etc/nagios/timeperiods.cfg
# The following timeperiod definition includes normal work hours. The
# 'timeperiod_name' and 'alias' directives are mandatory. Note that weekend days
# are simply omitted
define timeperiod {
  timeperiod_name    workhours
  alias              Work Hours
  monday             09:00-18:00
  tuesday            09:00-18:00
  wednesday          09:00-18:00
  thursday           09:00-18:00
  friday             09:00-18:00
}

# The following timeperiod includes all time outside normal work hours. The
# time slot between 6 p.m. and 9 a.m. must be split into two intervals, to avoid
# crossing midnight
define timeperiod {
  timeperiod_name    nonworkhours
  alias              Non-Work Hours
  sunday             00:00-24:00
  monday             00:00-09:00,18:00-24:00
  tuesday            00:00-09:00,18:00-24:00
  wednesday          00:00-09:00,18:00-24:00
  thursday           00:00-09:00,18:00-24:00
  friday             00:00-09:00,18:00-24:00
  saturday           00:00-24:00
}

# Most checks will probably run on a continuous basis
define timeperiod {
  timeperiod_name    always
  alias              Every Hour Every Day
  sunday             00:00-24:00
  monday             00:00-24:00
  tuesday            00:00-24:00
  wednesday          00:00-24:00
  thursday           00:00-24:00
  friday             00:00-24:00
  saturday           00:00-24:00
}

# The right timeperiod when you don't want to bother with notifications (e.g.
# on vacation or during testing)
define timeperiod {
  timeperiod_name    never
  alias              No Time is a Good Time
}

# Some exceptions to the normal weekly time (see documentation for more examples)
define timeperiod {
  timeperiod_name    exceptions
  alias              Some random dates
  2008-12-15         00:00-24:00        ; December 15th, 2008
  friday 3           00:00-24:00        ; 3rd Friday of every month
  february -1        00:00-24:00        ; Last day in February of every year
  march 20 - june 21 00:00-24:00        ; Spring
  day 1 - 15         00:00-24:00        ; First half of every month
  2008-01-01 / 7     00:00-24:00        ; Every 7 days from Jan 1st, 2008
}
3.2 Command definition
The next step is to tell Nagios how to perform the various checks and send out notifications; this is accomplished by defining multiple command objects specifying the actual commands for Nagios to run.
Command definitions are pairs of short names and command lines (both mandatory) and can contain macros. As we mentioned before, macros are variables, enclosed in "$" signs, that will get expanded to the appropriate value immediately prior to the execution of a command; macros allow you to keep command definitions generic and straightforward. A simple example will make this clear.
Suppose you want to monitor a web server with IP address "1.2.3.4"; you could then define a command such as the following:
define command {
  command_name    check-http
  command_line    /usr/local/libexec/nagios/check_http -I 1.2.3.4
}
This definition is correct and will certainly do the job. But what if you later decide to add a new web server? Would you find it convenient to define a new (almost identical) command, with only the IP address changed? It is way more efficient to take advantage of macros by writing a single generic command such as:
define command {
  command_name    check-http
  command_line    $USER1$/check_http -I $HOSTADDRESS$
}
and leave Nagios the responsibility to expand the built-in $HOSTADDRESS$ macro to the appropriate IP address, obtained from the host definition (see below). As you'll remember from the previous chapter, the $USER1$ macro holds the path to the plugins directory.
Now let's complicate things a bit! What if you want Nagios to check the availability of a particular URL on each web server? This URL may differ from server to server, so what we need now is a command definition that is still generic and yet server-specific! Though this may sound contradictory, once again Nagios solves this problem with macros: in fact, the $ARGn$ macros (where n is a number between 1 and 32 inclusive) act as placeholders for service-specific arguments that will be specified later within service definitions (see below for further details). Therefore, the above command definition would turn into:
define command {
  command_name    check-http
  command_line    $USER1$/check_http -I $HOSTADDRESS$ -u $ARG1$
}
In addition to the ones we have just seen, Nagios provides several other useful macros. Please refer to the documentation for a detailed list of all available macros and their validity context. Below is a sample set of command definitions.
/var/www/etc/nagios/commands.cfg
############################################################ ####################
# Notification commands #
# There are no standard notification plugins; hence notification commands are #
# usually custom scripts or mere command lines. #
############################################################ ####################
define command {
command_name host-notify-by-email
command_line $USER1$/host_notify_by_email.sh $CONTACTEMAIL$
}
define command {
command_name notify-by-email
command_line $USER1$/notify_by_email.sh $CONTACTEMAIL$
}
define command {
command_name host-notify-by-SMS
command_line /usr/local/bin/sendsms $ADDRESS1$ "Nagios: Host $HOSTNAME$ ($HOSTADDRESS$)is in state: $HOSTSTATE$"
}
define command {
command_name notify-by-SMS
command_line /usr/local/bin/sendsms $ADDRESS1$ "Nagios: Service $SERVICEDESC$ on $HOSTALIAS$ is in state: $SERVICESTATE$"
}
############################################################ ####################
# Check commands #
# The official Nagios plugins should handle most of your needs for host and #
# service checks. Anyway, should they not, we will discuss in a moment how to #
# write custom plugins. #
############################################################ ####################
define command {
command_name check-host-alive
command_line $USER1$/check_ping -H $HOSTADDRESS$ -w 3000.0,80% -c 5000.0,100% -p 1
}
define command {
command_name check-ssh
command_line $USER1$/check_ssh $HOSTADDRESS$
}
define command {
command_name check-http
command_line $USER1$/check_http -I $HOSTADDRESS$ -u $ARG1$
}
define command {
command_name check-smtp
command_line $USER1$/check_smtp -H $HOSTADDRESS$
}
define command {
command_name check-imap
command_line $USER1$/check_imap -H $HOSTADDRESS$
}
define command {
command_name check-dns
command_line $USER1$/check_dns -s $HOSTADDRESS$ -H $ARG1$ -a $ARG2$
}
define command {
command_name check-mysql
command_line $USER1$/check_mysql -H $HOSTADDRESS -u $USER2$ -p $USER3$
}
[...]
3.3 Contact definition
contact objects allow you to specify people who should be notified automatically when the alert conditions are met. Contacts are first defined individually and then grouped together in contactgroup objects, for easier management.
For the first time, in the following definitions, we will refer to previously defined objects. In fact, the values of the host_notification_period and service_notification_period directives must be timeperiod objects; and the values of the host_notification_command and service_notification_command directives must be command objects.
/var/www/etc/nagios/contacts.cfg
define contact {
# Short name to identify the contact
  contact_name                    john
# Longer name or description
  alias                           John Doe

# Enable notifications for this contact
  host_notifications_enabled      1
  service_notifications_enabled   1

# Timeperiods during which the contact can be notified about host and service
# problems or recoveries
  host_notification_period        always
  service_notification_period     always

# Host states for which notifications can be sent out to this contact
# (d=down, u=unreachable, r=recovery, f=flapping, n=none)
  host_notification_options       d,u,r

# Service states for which notifications can be sent out to this contact
# (w=warning, c=critical, u=unknown, r=recovery, f=flapping, n=none)
  service_notification_options    w,u,c,r

# Command(s) used to notify the contact about host and service problems
# or recoveries
  host_notification_commands      host-notify-by-email,host-notify-by-SMS
  service_notification_commands   notify-by-email,notify-by-SMS

# Email address for the contact
  email                           jdoe@kernel-panic.it

# Nagios provides 6 address directives (named address1 through address6) to
# specify additional "addresses" for the contact (e.g. a mobile phone number
# for SMS notifications)
  address1                        xxx-xxx-xxxx

# Allow this contact to submit external commands to Nagios from the CGIs
  can_submit_commands             1
}

# The following contact is split in two, to allow for different notification
# options depending on the timeperiod
define contact {
  contact_name                    danix@work
  alias                           Daniele Mazzocchio
  host_notifications_enabled      1
  service_notifications_enabled   1
  host_notification_period        workhours
  service_notification_period     workhours
  host_notification_options       d,u,r
  service_notification_options    w,u,c,r
  host_notification_commands      host-notify-by-email
  service_notification_commands   notify-by-email
  email                           danix@kernel-panic.it
  can_submit_commands             1
}

define contact {
  contact_name                    danix@home
  alias                           Daniele Mazzocchio
  host_notifications_enabled      1
  service_notifications_enabled   1
  host_notification_period        nonworkhours
  service_notification_period     nonworkhours
  host_notification_options       d,u
  service_notification_options    c
  host_notification_commands      host-notify-by-email,host-notify-by-SMS
  service_notification_commands   notify-by-email,notify-by-SMS
  email                           danix@kernel-panic.it
  address1                        xxx-xxx-xxxx
  can_submit_commands             1
}

[...]

# All administrator contacts are grouped together in the "Admins"
# contactgroup
define contactgroup {
  contactgroup_name               Admins
  alias                           Nagios Administrators
  members                         danix@work,danix@home,john
}

[...]
3.4 Host definition
Now we have finally come to one of the most important facets of Nagios configuration: the definition of the hosts (servers, workstations, devices, etc.) that we want to monitor. This will lead us to introduce one of the most powerful features of Nagios configuration: object inheritance. Note that, though we are discussing it now first, object inheritance applies to all Nagios objects; however, it's in the definition of hosts and services that you can get the most out of it.
In fact, configuring a host requires setting up quite a few parameters; and the value of these parameters will normally be the same for most hosts. Without object inheritance, this would mean wasting a lot of time typing the same parameters over and over again and eventually ending up with cluttered, overweight and almost unmanageable configuration files.
But luckily, Nagios is smart enough to save you a lot of typing by allowing you to define special template objects, whose properties can be "inherited" by other objects without having to rewrite them. Below is a brief example of how a template is created:
define host {
  name                            generic-host-template  # Template name

  check_command                   check-host-alive
  check_period                    always
  max_check_attempts              5
  notification_options            d,u,r

  register                        0                      # Don't register it!
}
As you can see, a template definition looks almost identical to a normal object definition. The only differences are:
- every template must be assigned a name with the name directive;
- since this is not an actual host, you must tell Nagios not to register it by setting the value of the register directive to 0; this property doesn't get inherited and defaults to 1, so you won't need to explicitely override it in all "children" objects;
- a template object can be left incomplete, i.e. it may not supply all mandatory parameters.
To create an actual host object from a template, you simply have to specify the template name as the value of the use directive and make sure that all mandatory fields are either inherited or explicitely set:
define host {
  host_name                       hostname
  use                             generic-host-template
  alias                           alias
  address                         x.x.x.x
}
Well, now let's move from theory to practice and define two host templates for our servers. Note that the second one inherits from the first; this is possible because Nagios allows multiple levels of template objects.
/var/www/etc/nagios/generic-hosts.cfg
# The following is a template for all hosts in the LAN
define host {
# Template name
  name                            generic-lan-host

# Command to use to check the state of the host
  check_command                   check-host-alive

# Contact groups to notify about problems (or recoveries) with this host
  contact_groups                  Admins

# Enable active checks
  active_checks_enabled           1
# Time period during which active checks of this host can be made
  check_period                    always
# Number of times that Nagios will repeat a check returning a non-OK state
  max_check_attempts              3

# Enable the event handler
  event_handler_enabled           1

# Enable the processing of performance data
  process_perf_data               1

# Enable retention of host status information across program restarts
  retain_status_information       1
# Enable retention of host non-status information across program restarts
  retain_nonstatus_information    1

# Enable notifications
  notifications_enabled           1
# Time interval (in minutes) between consecutive notifications about the
# server being _still_ down or unreachable
  notification_interval           120
# Time period during which notifications about this host can be sent out
  notification_period             always
# Host states for which notifications should be sent out (d=down,
# u=unreachable, r=recovery, f=flapping, n=none)
  notification_options            d,u,r

# Don't register this definition: it's only a template, not an actual host
  register                        0
}

# DMZ hosts inherit all attributes from the generic-lan-host by means of the
# 'use' directive. The only difference is that Nagios has to go through the
# internal (CARP) firewalls to reach the DMZ servers, thus requiring the
# additional 'parents' directive.
define host {
  name                            generic-dmz-host

# The 'use' directive specifies the name of a template object that you want
# this host to inherit properties from
  use                             generic-lan-host

# This directive specifies the hosts that lie between the monitoring host
# and the remote host (more information here)
  parents                         fw-int

# This too is a template
  register                        0
}
Now we can take advantage of our templates to define the actual hosts in a few lines.
/var/www/etc/nagios/hosts/servers.cfg
# Configuration for host dns1.lan.kernel-panic.it
define host {
  use                             generic-lan-host
  host_name                       dns1
  alias                           LAN primary master name server
  address                         172.16.0.161

# Extended information
  notes                           This is the internal primary master name server (Bind 9.4.2-P2)
# URL with more information about this host
  notes_url                       http://www.kernel-panic.it/openbsd/dns/
# Image associated with this host in the status CGI; images must be placed in
# /var/www/nagios/images/logos/
  icon_image                      dns.png
# String used in the 'alt' tag of the icon_image
  icon_image_alt                  [dns]
# Image associated with this host in the statusmap CGI
  statusmap_image                 dns.gd2
}

# Configuration for host mail.kernel-panic.it
define host {
  use                             generic-dmz-host
  host_name                       mail
  alias                           Mail server
  address                         172.16.240.150
  notes                           This is the Postfix mail server (with IMAP(S) and web access)
  notes_url                       http://www.kernel-panic.it/openbsd/mail/
  icon_image                      mail.png
  icon_image_alt                  [Mail]
  statusmap_image                 mail.gd2
}

# Configuration for host proxy.kernel-panic.it
define host {
  use                             generic-dmz-host
  host_name                       proxy
  alias                           Proxy server
  notes                           This is the Squid proxy server
  notes_url                       http://www.kernel-panic.it/openbsd/proxy/
  icon_image                      proxy.png
  icon_image_alt                  [Proxy]
  statusmap_image                 proxy.gd2
}

[...]
/var/www/etc/nagios/hosts/firewalls.cfg
# Configuration for host fw-int.kernel-panic.it
define host {
  use                             generic-lan-host
  host_name                       fw-int
  alias                           Internal firewalls' CARP address
  address                         172.16.0.202
  notes                           Virtual CARP address of the internal firewalls
  notes_url                       http://www.kernel-panic.it/openbsd/carp/
  icon_image                      fw.png
  icon_image_alt                  [FW]
  statusmap_image                 fw.gd2
}

# Configuration for host mickey.kernel-panic.it
define host {
  use                             generic-lan-host
  host_name                       mickey
  alias                           Internal Firewall #1
  address                         172.16.0.200
  notes                           Internal firewall (first node of a two-nodes CARP cluster)
  notes_url                       http://www.kernel-panic.it/openbsd/carp/
  icon_image                      fw.png
  icon_image_alt                  [FW]
  statusmap_image                 fw.gd2
}

[...]
Hosts can optionally be grouped together with the hostgroup statement, which has no effect on monitoring, but simply allows you to display the hosts in groups in the CGIs.
/var/www/etc/nagios/hosts/hostgroups.cfg
# Domain Name Servers
define hostgroup {
  hostgroup_name                  DNS
  alias                           Domain Name Servers
  members                         dns1,dns2,dns3,dns4
  notes                           Our internal Domain Name Servers, running Bind 9.4.2-P2
}

# Firewalls
define hostgroup {
  hostgroup_name                  firewalls
  alias                           CARP Firewalls
  members                         mickey,minnie,donald,daisy,fw-int,fw-ext
  notes                           Our CARP-enabled firewalls (both virtual and physical addresses)
}

# Web servers
define hostgroup {
  hostgroup_name                  WWW
  alias                           Web Servers
  members                         www1,www2
  notes                           Our corporate web servers, running Apache 1.3
}
3.5 Service definition
Configuring the services to monitor is much like configuring hosts: object inheritance can save you a lot of typing and you can group services together with the optional servicegroup statement. Below is the definition of our service template:
/var/www/etc/nagios/generic-services.cfg
define service {
# Template name
  name                            generic-service

# Services are normally not volatile
  is_volatile                     0

# Contact groups to notify about problems (or recoveries) with this service
  contact_groups                  Admins

# Enable active checks
  active_checks_enabled           1
# Time period during which active checks of this service can be made
  check_period                    always
# Time interval (in minutes) between "regular" checks, i.e. checks that
# occur when the service is in an OK state or when the service is in a non-OK
# state, but has already been re-checked max_check_attempts number of times
  normal_check_interval           5
# Time interval (in minutes) between non-regular checks
  retry_check_interval            1
# Number of times that Nagios will repeat a check returning a non-OK state
  max_check_attempts              3
# Enable service check parallelization for better performance
  parallelize_check               1
# Enable passive checks
  passive_checks_enabled          1

# Enable the event handler
  event_handler_enabled           1

# Enable the processing of performance data
  process_perf_data               1

# Enable retention of service status information across program restarts
  retain_status_information       1
# Enable retention of service non-status information across program restarts
  retain_nonstatus_information    1

# Enable notifications
  notifications_enabled           1
# Time interval (in minutes) between consecutive notifications about the
# service being _still_ in non-OK state
  notification_interval           120
# Time period during which notifications about this service can be sent out
  notification_period             always
# Service states for which notifications should be sent out (c=critical,
# w=warning, u=unknown, r=recovery, f=flapping, n=none)
  notification_options            w,u,c,r

  register                        0
}
Now, before moving to services definitions, we should complete our discussion on passing service-specific arguments to commands by means of the $ARGn$ macros. As you'll remember, these macros act as placeholders: they expand to the nth argument passed to the command in the service definition; for instance, a command definition such as the following expects to be passed two arguments:
define command {
  command_name                    some-command
  command_line                    $USER1$/check_something $ARG1$ $ARG2$
}
Therefore, to configure a service check to use the above command, we will need to assign the check_command variable a string containing the command's short name followed by the arguments, separated by "!" characters. E.g.:
define service {
  service_description             some-service
  check_command                   some-command!arg-1!arg-2
  [...]
}
Now we can proceed to the definition of the actual services:
/var/www/etc/nagios/services/services.cfg
# Secure Shell service
define service {
  use                             generic-service
  service_description             SSH
# Short name(s) of the host(s) that run this service. If a service runs on all
# hosts, you may use the '*' wildcard character
  host_name                       *
  check_command                   check-ssh
# This directive is a possible alternative to using the members directive in
# service groups definitions
  servicegroups                   ssh-services
# Extended information
  notes                           Availability of the SSH daemon
  notes_url                       http://www.openssh.org/
  icon_image                      ssh.png
  icon_image_alt                  [SSH]
}

# Web service
define service {
  use                             generic-service
  service_description             WWW
  host_name                       www1,www2
  check_command                   check-http!/index.html
  notes                           Availability of the corporate web sites
  notes_url                       http://www.apache.org/
  icon_image                      www.png
  icon_image_alt                  [WWW]
}

define service {
  use                             generic-service
  service_description             WWW
  host_name                       mail
  check_command                   check-http!/webmail/index.html
  notes                           Availability of the web access to the mail server
  notes_url                       http://www.squirrelmail.org/
  icon_image                      www.png
  icon_image_alt                  [WWW]
}

[...]
Just like hosts, services can be grouped together with the servicegroup directive:
/var/www/etc/nagios/services/servicegroups.cfg
define servicegroup {
  servicegroup_name               www-services
  alias                           Web Services
# The 'members' directive requires a comma-separated list of host and
# service pairs, e.g. 'host1,service1,host2,service2,...'
  members                         www1,WWW,www2,WWW,mail,WWW
}

define servicegroup {
  servicegroup_name               dns-services
  alias                           Domain Name Service
  members                         dns1,DNS,dns2,DNS,dns3,DNS,dns4,DNS
}

# The members of the following servicegroup are specified with the
# 'serviecegroups' directive in the 'SSH' service definition
define servicegroup {
  servicegroup_name               ssh-services
  alias                           Secure Shell Service
}

[...]
Well, the bulk of the work is over now: the last step is configuring the web interface and then we will finally be able to set our Nagios server to work!
4. Setting up the web interface
Nagios doesn't have a specific client application to access the monitoring information; instead, it relies on the Apache web server to provide a very simple yet powerful web interface, accessible via any browser and allowing users to access current status information, browse historical logs, create reports and, if so configured, issue commands to the monitoring daemon.
4.1 CGIs configuration
Nagios' web interface relies on a series of CGI programs written in C. The CGIs read their configuration information from two files: the main configuration file and cgi.cfg, located, by default, in the /var/www/etc/nagios/ directory.
Below is a sample configuration file; pay particular attention when setting the authorized_for_* directives, because they allow you to assign special privileges to authenticated users and are, therefore, highly security critical. In the next section, we will review how to create users in Apache.
/var/www/etc/nagios/cgi.cfg
# Path to the main configuration file (relative to the chroot)
main_config_file=/etc/nagios/nagios.cfg
# Path to the directory where the HTML files reside (relative to the chroot)
physical_html_path=/nagios
# Path portion of the URL used to access the web interface
url_html_path=/nagios

# Disable context-sensitive help
show_context_help=0

# Enable authentication for the CGIs
use_authentication=1
# Uncomment the following directive to set a default user for unauthenticated
# sessions (strongly discouraged)
#default_user_name=guest

# The 'authorized_for_*' directives define a comma-separated list of
# authenticated web users who can:
# - view system/process information in the extended information CGI:
authorized_for_system_information=nagiosadmin,operator
# - view configuration information in the configuration CGI:
authorized_for_configuration_information=nagiosadmin,operator
# - issue system/process commands via the command CGI:
authorized_for_system_commands=nagiosadmin
# - view status and configuration information for all services
authorized_for_all_services=nagiosadmin,operator
# - view status and configuration information for all hosts
authorized_for_all_hosts=nagiosadmin,operator
# - issue commands for all services via the command CGI:
authorized_for_all_service_commands=nagiosadmin
# - issue commands for all hosts via the command CGI:
authorized_for_all_host_commands=nagiosadmin

# Options for the Status Map and Status World CGIs
statusmap_background_image=smbackground.gd2
default_statusmap_layout=5
default_statuswrl_layout=4
statuswrl_include=myworld.wrl

# Command to use when attempting to ping a host from the WAP interface
ping_syntax=/sbin/ping -n -c 5 $HOSTADDRESS$

# Time interval (in seconds) between page refreshes
refresh_rate=90

# List of audio files to play in the browser in case of problems. These files
# are assumed to be in the /var/www/nagios/media/ directory
host_unreachable_sound=hostdown.wav
host_down_sound=hostdown.wav
service_critical_sound=critical.wav
service_warning_sound=warning.wav
service_unknown_sound=warning.wav
#normal_sound=noproblem.wav

# HTML and URL target options
action_url_target=_blank
notes_url_target=_blank
escape_html_tags=1

# Restrict users from changing the author name when submitting comments,
# acknowledgements and scheduled downtime from the web interface
lock_author_names=1

# Splunk integration options
enable_splunk_integration=0
#splunk_url=http://127.0.0.1:8000/
4.2 Apache configuration
The web interface holds particularly sensitive information about network and services and may even allow the execution of commands that directly affect the monitoring daemon. As a consequence, it is strongly recommended that you configure authentication for accessing the CGIs.
User authentication files are managed with the htpasswd(1) utility. Note that the first time you run this command, you must supply the "-c" option to create the password file:
# htpasswd -c /var/www/users/nagios.passwd nagiosadmin
New password: password
Re-type new password: password
Adding password for user nagiosadmin
# htpasswd /var/www/users/nagios.passwd danix@work
New password: password
Re-type new password: password
Adding password for user danix@work
#
An authenticated user whose username matches the short name of a contact definition is called an authenticated contact and is automatically granted access to information and commands for those hosts and services for which he is contact (please refer to the documentation for further details about authentication in the CGIs).
Well, now that we have Apache requiring users to authenticate, we should also configure SSL to avoid sending passwords in clear text. Below are the openssl(1) commands to create a self-signed certificate (a more detailed discussion about certificate management can be found here).
# openssl genrsa -des3 -out server.3des-key 1024
Generating RSA private key, 1024 bit long modulus
..............++++++
.++++++
e is 65537 (0x10001)
Enter pass phrase for server.3des-key: passphrase
Verifying - Enter pass phrase for server.3des-key: passphrase
# openssl rsa -in server.3des-key -out server.key
Enter pass phrase for server.3des-key: passphrase
writing RSA key
# openssl req -new -key server.key -x509 -out server.crt -days 365
You are about to be asked to enter information that will be incorporated
into your certificate request.
What you are about to enter is what is called a Distinguished Name or a DN.
There are quite a few fields but you can leave some blank
For some fields there will be a default value,
If you enter '.', the field will be left blank.
-----
Country Name (2 letter code) []: IT
State or Province Name (full name) []: State
Locality Name (eg, city) []: Locality
Organization Name (eg, company) []: kernel-panic.it
Organizational Unit Name (eg, section) []: Information Technology
Common Name (eg, fully qualified host name) []: nagios.kernel-panic.it
Email Address []: nagios@kernel-panic.it
# chmod 600 server.key
# rm server.3des-key
# mv server.crt /etc/ssl/
# mv server.key /etc/ssl/private/
The last step is configuring Apache to actually require authentication and encryption to access the Nagios interface by adding the following lines to the /var/www/conf/httpd.conf configuration file:
/var/www/conf/httpd.conf
ScriptAlias /cgi-bin/nagios "/var/www/cgi-bin/nagios"


  SSLRequireSSL

  Options ExecCGI

  AuthName "Nagios Access"
  AuthType Basic
  AuthUserFile /users/nagios.passwd
  Require valid-user

  Order deny,allow
  Deny from all
  # Authorized clients
  Allow from 127.0.0.1 172.16.0.13


Alias /nagios "/var/www/nagios"


  SSLRequireSSL

  Options None
  AllowOverride None

  AuthName "Nagios Access"
  AuthType Basic
  AuthUserFile /users/nagios.passwd
  Require valid-user

  Order deny,allow
  Deny from all
  # Authorized clients
  Allow from 127.0.0.1 172.16.0.13
4.3 Running Nagios
Well, it looks like we're done with the configuration for now! Then we can make Nagios evaluate our hard work by invoking it with the "-v" option:
# /usr/local/sbin/nagios -v /var/www/etc/nagios/nagios.cfg

Nagios 3.0.3
Copyright (c) 1999-2008 Ethan Galstad (http://www.nagios.org)
Last Modified: 06-25-2008
License: GPL

Reading configuration data...

Running pre-flight check on configuration data...

[...]

Total Warnings: 0
Total Errors:   0

Things look okay - No serious problems were detected during the pre-flight check
#
If no errors were detected, then the long-awaited moment has arrived: we are ready to start Nagios! Though not before having created the directory for the lock file (Note: if you haven't rebooted since installing the Nagios packages, the /var/run/nagios/ directory should already exist).
# apachectl startssl
/usr/sbin/apachectl startssl: httpd started
# install -d -o _nagios /var/run/nagios
# /usr/local/sbin/nagios -d /var/www/etc/nagios/nagios.cfg
You can check if everything is working fine by connecting to the web interface (https://your.server.here/nagios/) or taking a look at the logs (/var/www/var/log/nagios/nagios.log).
To finish up, we have to configure the system to start both Apache and Nagios at boot time, by setting the httpd_flags variable in the /etc/rc.conf.local file:
/etc/rc.conf.local
httpd_flags="-DSSL"
and by adding the following lines to the /etc/rc.local file:
/etc/rc.local
if [ -x /usr/local/sbin/nagios ]; then
  install -d -o _nagios /var/run/nagios
  echo -n ' nagios'
  /usr/local/sbin/nagios -d /var/www/etc/nagios/nagios.cfg
fi
5. Nagios addons
One of Nagios' key features is its extensibility; new functionality can be easily added thanks to its plugin-based architecture, the external command interface and the Apache web server. In this chapter, we will take a look at a few common issues that can be addressed with some of the most popular addons for Nagios.
5.1 NRPE
Suppose you want Nagios to monitor local services on remote hosts, such as disk space usage, system load or the number of users currently logged in. These are not network services, so they can't be directly checked out with standard plugins: what we would need is some kind of agent to install on remote systems and that Nagios could periodically query for the status of local services.
Well, that's exactly what the Nagios Remote Plugin Executor (NRPE) does: it allows you to execute local plugins on remote hosts
! It is made up of two components:
- an agent, running (either standalone or under inetd(8)) on the monitored host, which waits for incoming connections, executes the requested checks and returns the status of the local services;
- a plugin, "check_nrpe", used by Nagios to query the remote agents.
Both the agent and the plugin are available from the following package:
- nrpe-x.x.x.tgz
In addition, the Nagios plugins package will be installed on the monitored host as a dependency: this will allow the NRPE agent to take advantage of the standard Nagios plugins to perform local checks. The package installation automatically creates the _nrpe user and group that the daemon will run as and copy a sample nrpe.cfg configuration file in /etc/:
/etc/nrpe.cfg
# Path to the pid file (ignored if running under inetd)
pid_file=/var/run/nrpe.pid

# Address to bind to, to avoid binding on all interfaces (ignored if running
# under inetd)
server_address=172.16.0.170
# Port to wait connections on (ignored if running under inetd)
server_port=5666

# User and group the NRPE daemon should run as (ignored if running under inetd)
nrpe_user=_nrpe
nrpe_group=_nrpe

# Comma-delimited list of IP addresses or hostnames that are allowed to connect
# to the NRPE daemon (ignored if running under inetd)
allowed_hosts=127.0.0.1,172.16.0.164

# Don't allow clients to specify arguments to commands that are executed
dont_blame_nrpe=0

# Uncomment the following option to prefix all commands with a specific string
#command_prefix=/usr/bin/sudo

# Don't log debugging messages to the syslog facility
debug=0

# Maximum length (in seconds) of executed plugins
command_timeout=60

# Command definitions are in the form
#
#   command[]=
#
# Thus, when the NRPE daemon receives a request to execute the command
# 'command_name', it will run the *local* script specified by 'command_line'.
# Note: macros are NOT allowed within command definitions
command[check_users]=/usr/local/libexec/nagios/check_users -w 5 -c 10
command[check_load]=/usr/local/libexec/nagios/check_load -w 15,10,5 -c 30,25,20
command[check_disk1]=/usr/local/libexec/nagios/check_disk -w 20 -c 10 -p /dev/wd0a
command[check_total_procs]=/usr/local/libexec/nagios/check_procs -w 150 -c 200
To run NRPE as a standalone daemon, simply type:
# /usr/local/sbin/nrpe -c /etc/nrpe.cfg -d
and add the following lines to /etc/rc.local to start it automatically after reboot:
/etc/rc.local/
if [ -x /usr/local/sbin/nrpe ]; then
  echo -n ' nrpe'
  /usr/local/sbin/nrpe -c /etc/nrpe.cfg -d
fi
Alternatively, you can run NRPE under inetd(8) by adding the following line in /etc/inetd.conf(8):
/etc/inetd.conf
nrpe stream tcp wait _nrpe:_nrpe /usr/local/sbin/nrpe nrpe -c /etc/nrpe.cfg -i
and by adding the nrpe service in /etc/services(5):
/etc/services
nrpe 5666/tcp # Nagios Remote Plugin Executor
and then send the inetd(8) daemon the hangup signal, instructing it to re-read its configuration:
# pkill -HUP inetd
Now, on the Nagios server, you can perform checks using NRPE simply by defining commands such as the following (only make sure that the command name passed to the "-c" option has a corresponding command definition in the nrpe.cfg file on the remote host!):
/var/www/etc/nagios/commands.cfg
define command {
  command_name    check-disk1-nrpe
  command_line    $USER1$/check_nrpe -H $HOSTADDRESS$ -c check_disk1
}
5.2 NSCA
Now suppose you want to monitor the correct execution of a process on a remote host, like a scheduled backup or a crontab job. This is still a "local" service, but, unlike disk space usage or system load, it would probably sound more logical to make it the responsibility of the job itself to notify Nagios of its exit status. That's the perfect job for the Nagios Service Check Acceptor (NSCA), which is a daemon program, meant to run on the Nagios server, designed to accept passive service check results from clients
.
NSCA is similar to NRPE in that it is made up of a daemon process and a client application, but now the roles are inverted: the daemon process runs on the Nagios server while remote hosts use the send_nsca utility to communicate their status to the daemon. NSCA then forwards the check results to Nagios through the external command interface (so make sure you have enabled external commands in the main configuration file).
5.2.1 Server configuration
NSCA can run either as a standalone daemon or under inetd(8). To install the server component we need to add the following packages on the Nagios server:
- pcre-x.x.tgz
- glib2-x.x.x.tgz
- mhash-x.x.x.tgz
- libmcrypt-x.x.x.tgz
- nsca-x.x.tgz
Next, we need to edit the /etc/nsca.cfg configuration file:
/etc/nsca.cfg
# Path to the pid file (ignored if running under inetd)
pid_file=/var/run/nrpe.pid

# Address to bind to (optional)
server_address=172.16.0.164
# Port to wait connections on
server_port=5667

# User and group the NSCA daemon should run as (ignored if running under inetd)
nsca_user=_nagios
nsca_group=_nagios

# chroot(2) directory for the NSCA daemon
nsca_chroot=/var/www/var/nagios/rw

# Don't log debugging messages to the syslog facility
debug=0

# Path to the command file (relative to the chroot directory)
command_file=nagios.cmd
# File where to dump service check results if the command file does not exist
alternate_dump_file=nsca.dump

# Do not aggregate writes to the external command file
aggregate_writes=0
# Open the external command file in write mode
append_to_file=0

# Maximum packet age (in seconds)
max_packet_age=30

# Password to use to decrypt incoming packets
password=password
# Decryption method (16 = RIJNDAEL-256). It must match the encryption method
# used by the client
decryption_method=16
You should set restrictive permissions (600) on the configuration file in order to keep the decryption password protected. To run NSCA as a standalone daemon, simply type:
# /usr/local/sbin/nsca -c /etc/nsca.cfg
and add the following lines to /etc/rc.local to start it automatically after reboot:
/etc/rc.local
if [ -x /usr/local/sbin/nsca ]; then
  echo -n ' nsca'
  /usr/local/sbin/nsca -c /etc/nsca.cfg
fi
Alternatively, you can run it under inetd(8) by adding the following line in /etc/inetd.conf(8):
/etc/inetd.conf
nsca stream tcp wait _nagios:_nagios /usr/local/sbin/nsca nsca -c /etc/nsca.cfg --inetd
and by adding the nsca service in /etc/services(5):
/etc/services
nsca 5667/tcp # Nagios Service Check Acceptor
and then send the inetd(8) daemon the hangup signal, instructing it to re-read its configuration:
# pkill -HUP inetd
5.2.2 Client configuration
On the client side, we need to install the following packages:
- mhash-x.x.x.tgz
- libmcrypt-x.x.x.tgz
- nsca-client-x.x.tgz
and edit the encryption parameters in the /etc/send_nsca.cfg configuration file:
/etc/send_nsca.cfg
# Password to use to encrypt outgoing packets
password=password
# Encryption method (16 = RIJNDAEL-256)
encryption_method=16
The send_nsca utility reads data from standard input and expects, for service checks, a tab separated sequence of host name, service description (i.e. the value of the service_description directive in the service definition), return code and output; e.g.:
echo "www1\tbackup\t0\tBackup completed successfully" | /usr/local/libexec/nagios/send_nsca -H nagios.kernel-panic.it
and, for host checks, a tab separated sequence of host name, return code and output; e.g.:
echo "router1\t2\tRouter #1 is down" | /usr/local/libexec/nagios/send_nsca -H nagios.kernel-panic.it
You can override the default delimiter (tab) with send_nsca's "-d" option. Now, if everything is working fine, each message received by the NSCA daemon should produce a line like the following in the Nagios log file:
/var/www/var/log/nagios/nagios.log
[1167325538] EXTERNAL COMMAND: PROCESS_SERVICE_CHECK_RESULT;www1;backup;0;Backup completed successfully
5.3 NagVis and NDO
NagVis is a visualization addon for Nagios; it can be used to give users a graphical view of Nagios data. It requires the installation of PHP and a few libraries:
- libxml-x.x.x.tgz
- t1lib-x.x.x.tgz
- jpeg-x.tgz
- png-x.x.x.tgz
- php5-core-x.x.x.tgz
- php5-gd-x.x.x-no_x11.tgz
- mysql-client-x.x.x.tgz
- php5-mysql-x.x.x.tgz
Apache is already up and running, so we only need to enable the php modules we have just installed:
# ln -s /var/www/conf/modules.sample/php5.conf /var/www/conf/modules
# ln -fs /var/www/conf/php5.sample/gd.ini /var/www/conf/php5/gd.ini
# ln -fs /var/www/conf/php5.sample/mysql.ini /var/www/conf/php5/mysql.ini
uncomment the following line in /var/www/conf/httpd.conf:
/var/www/conf/httpd.conf
AddType application/x-httpd-php .php
and restart Apache:
# apachectl restart
/usr/sbin/apachectl restart: httpd restarted
5.3.1 Installing NDO and MySQL
Prior to version 1.0, NagVis was able to pull data from Nagios directly from its web interface; now this is not supported anymore and NagVis expects monitoring data to be stored in a MySQL database, thus requiring the intallation of the Nagios Data Output Utils (NDOUTILS) addon.
The NDOUTILS addon allows you to export current and historical data from one or more Nagios instances to a MySQL database
, thus providing the interface between Nagios and MySQL. This addon consists of several parts, but we will need only two of them:
- the NDOMOD event broker module, which is loaded by Nagios at startup and dumps all events and data from Nagios to a Unix or TCP socket;
- the NDO2DB daemon, which is a standalone daemon and reads the output produced by the NDOMOD module through the Unix or TCP socket and dumps it into the database.
First off, we need to install MySQL; the following is the list of the required packages:
- p5-Net-Daemon-x.x.tgz
- p5-PlRPC-x.x.tgz
- p5-DBI-x.x.tgz
- p5-DBD-mysql-x.x.tgz
- mysql-server-x.x.x.tgz
Next, we need to download, extract and compile the NDOUTILS tarball:
# tar -zxvf ndoutils-x.x.x.tar.gz
[ ... ]
# cd ndoutils-x.x.x
# ./configure --disable-pgsql --enable-mysql --with-mysql-lib=/usr/local/lib \
>   --with-mysql-inc=/usr/local/include
[ ... ]
# make
Note: if make fails to compile the dbhandlers.c file, try installing this patch (applies to version 1.4b7) by running the following command from outside the ndoutils source tree:
# patch -p0 <>
Now we can start MySQL, assign a password to the root account and create the appropriate database and user. The database creation script can be found in the db/ directory of the extracted tarball.
# cp /usr/local/share/mysql/my-medium.cnf /etc/my.cnf
# /usr/local/bin/mysql_install_db
[ ... ]
# mysqld_safe &
Starting mysqld daemon with databases from /var/mysql
# /usr/local/bin/mysql_secure_installation
[ ... ]
Enter current password for root (enter for none):
[ ... ]
Set root password? [Y/n] Y
New password: root
Re-enter new password: root
[ ... ]
Remove anonymous users? [Y/n] Y
[ ... ]
Disallow root login remotely? [Y/n] Y
[ ... ]
Remove test database and access to it? [Y/n] Y
[ ... ]
Reload privilege tables now? [Y/n] Y
[ ... ]
# mysql -u root -p
password: root
Welcome to the MySQL monitor.  Commands end with ; or \g.
Server version: 5.0.51a-log OpenBSD port: mysql-server-5.0.51a

Type 'help;' or '\h' for help. Type '\c' to clear the buffer.

mysql> create database nagios;
Query OK, 1 row affected (0.02 sec)

mysql> use nagios;
Database changed
mysql> \.  db/mysql.sql
[...]
mysql> GRANT SELECT, INSERT, UPDATE, DELETE ON nagios.* TO 'ndouser'@'localhost' IDENTIFIED BY 'ndopasswd';
mysql> \q
Now we need to manually copy the binaries and configuration files:
# cp src/ndomod-3x.o /usr/local/libexec/nagios/ndomod.o
# cp config/ndomod.cfg /var/www/etc/nagios/
# cp src/ndo2db-3x /usr/local/sbin/ndo2db
# cp config/ndo2db.cfg /var/www/etc/nagios/
and edit the NDOMOD configuration file:
/var/www/etc/nagios/ndomod.cfg
instance_name=default
output_type=unixsocket
output=/var/nagios/rw/ndo.sock
tcp_port=5668

output_buffer_items=5000
buffer_file=/var/nagios/rw/ndomod.tmp

file_rotation_interval=14400
file_rotation_timeout=60

reconnect_interval=15
reconnect_warning_interval=15
data_processing_options=-1
config_output_options=3
and the NDO2DB configuration file:
/var/www/etc/nagios/ndo2db.cfg
ndo2db_user=_nagios
ndo2db_group=_nagios

socket_type=unix
socket_name=/var/www/var/nagios/rw/ndo.sock
tcp_port=5668

db_servertype=mysql
db_host=localhost
db_port=3306
db_name=nagios
db_prefix=nagios_
db_user=ndouser
db_pass=ndopasswd

max_timedevents_age=1440
max_systemcommands_age=10080
max_servicechecks_age=10080
max_hostchecks_age=10080
max_eventhandlers_age=44640

debug_level=0
debug_verbosity=1
debug_file=/var/www/var/log/nagios/ndo2db.debug
max_debug_file_size=1000000
Then we have to specify the event broker module that Nagios must load at startup, by adding the following line to the main configuration file:
/var/www/etc/nagios/nagios.cfg
broker_module=/usr/local/libexec/nagios/ndomod.o config_file=/var/www/etc/nagios/ndomod.cfg
and, finally, we can start the NDO2DB daemon and restart Nagios:
# /usr/local/sbin/ndo2db -c /var/www/etc/nagios/ndo2db.cfg
# chmod 770 /var/www/var/nagios/rw/ndo.sock
# pkill nagios
# nagios -d /var/www/etc/nagios/nagios.cfg
Add the following lines to /etc/rc.local to start the NDO2DB daemon on boot:
/etc/rc.local
if [ -x /usr/local/sbin/ndo2db ]; then
  echo -n ' ndo2db'
  /usr/local/sbin/ndo2db -c /var/www/etc/nagios/ndo2db.cfg
  chmod 770 /var/www/var/nagios/rw/ndo.sock
fi
5.3.2 Configuring NagVis
Now that we have installed all the necessary prerequisites, we can download and extract the NagVis tarball:
# cd /var/www/nagios/
# tar -zxvf nagvis-x.x.x.tar.gz
[ ... ]
# mv nagvis-x.x.x nagvis
# chown -R www /var/www/nagios/nagvis/{etc,var}
Below is a sample NagVis configuration file; please refer to the documentation for a detailed description of each parameter:
/var/www/nagios/nagvis/etc/nagvis.ini.php
;

[global]
language             = "english"
displayheader        = 1
refreshtime          = 60
dateformat           = "Y-m-d H:i:s"

[defaults]
backend              = "ndomy_1"
; Default icons' size (icons can be found in
; /var/www/nagios/nagvis/images/iconsets)
icons                = "std_medium"
recognizeservices    = 1
onlyhardstates       = 0
backgroundcolor      = "#fff"
headertemplate       = "default"
hovertemplate        = "default"
hoverdelay           = 0
showinlists          = 1
; Use gdlibs (if set to 0 lines will not work, all other types should work fine)
usegdlibs            = 1
urltarget            = "_self"

[wui]
autoupdatefreq       = 25
maplocktime          = 5
allowedforconfig     = nagiosadmin

[paths]
base                 = "/nagios/nagvis/"
htmlbase             = "/nagios/nagvis"
htmlcgi              = "/cgi-bin/nagios"

[backend_ndomy_1]
backendtype          = "ndomy"
dbhost               = "127.0.0.1"
dbport               = 3306
dbname               = "nagios"
dbuser               = "ndouser"
dbpass               = "ndopasswd"
dbprefix             = "nagios_"
dbinstancename       = "default"
maxtimewithoutupdate = 180
htmlcgi              = "/cgi-bin/nagios"

; In this example, the browser switches between the 'dmz' and 'lan' maps every
; 15 seconds. The rotation is enabled by specifying the URL:
; https://your.nagios.server/nagios/nagvis/index.php?rotation=kp
[rotation_kp]
maps                 = "dmz,lan"
interval             = 15

[automap]
showinlists=0
5.3.3 Maps definition
Now we have to create the images for NagVis to use as the background for each map and put them in the /var/www/nagios/nagvis/images/maps/ directory. You can find a few examples here.
Once the map images are ready, we can tell NagVis where to place objects on the map by creating and editing the maps configuration files. Each map must have a corresponding configuration file (in /var/www/nagios/nagvis/etc/maps/) with the same name, plus the ".cfg" extension. Below is a sample map configuration file; syntax is rather simple, so you can easily tweak it to include your own hosts and services (please refer to the documentation for further details).
/var/www/nagios/nagvis/etc/maps/dmz.cfg
# The 'global' statement sets some default values that will be inherited by all
# other objects
define global {
# List of users allowed to view this map
  allowed_user=nagiosadmin,operator
# List of users allowed to modify this map via the web interface
  allowed_for_config=nagiosadmin
# Defaul iconset (if omitted, it is inherited from the main configuration file)
  iconset=std_medium
# Background image
  map_image=dmz.png
}

# Display the status of our 'www1' web server
define host {
  host_name=www1
# Coordinates of the host on the map
  x=268
  y=166
# Set this to '1' if you want the host status to also include the status
# of its services
  recognize_services=0
}

# Display the status of the 'WWW' service on the 'www1' web server
define service {
  host_name=www1
  service_description=WWW
  x=588
  y=165
# As you can see, 'global' options can be overridden in subsequent objects
  iconset=std_small
}

# Display the worsest state of hosts in the 'WWW' hostgroup
define hostgroup {
  hostgroup_name=WWW
  x=298
  y=363
  recognize_services=1
}

# Display the worsest state of services in the 'www-services' servicegroup
define servicegroup {
  servicegroup_name=www-services
  x=609
  y=363
}

# Display the worsest state of objects represented in another NagVis map
define map {
  map_name=lan
  x=406
  y=323
}

# Draw a textfield on the map
define textbox {
# Text may include HTML
  text="This is the DMZ network"
  x=490
  y=394
  w=117
}
To allow the web interface to modify NagVis' configuration, make sure that all configuration files belong to, and are writable by, the www user.
# chown www /var/www/nagios/nagvis/etc/maps/*.cfg
# chmod 644 /var/www/nagios/nagvis/etc/maps/*.cfg
6. Writing your own Nagios plugins
Plugins are executable files run by Nagios to determine the status of a host or service. By default, Nagios comes with a very rich set of official plugins that should cover most people's needs; in addition, you can find lots of contributed plugins on the Nagios Exchange website, some of which are also available via OpenBSD's packages and ports system.
However, despite the abundance of plugins, there may be occasions in which no existing plugin is suitable for monitoring a particular service, thus forcing you to write a fully custom plugin, tailored to your exact needs. Luckily, this is a very simple task!
Nagios doesn't bind you to a specific programming language: plugins may be either compiled C programs or interpreted scripts, in Perl, shell or Python. Nagios doesn't mess with the internals of plugins; however, it asks developers to follow a few basic guidelines, just for standard's sake.
6.1 Command line options
A plugin's command line must follow some specific requirements:
- positional arguments are strongly discouraged;
- all plugins should provide a "-V" command-line option (and "--version" if long options are enabled) to display the plugin's revision number;
- the "-?" option, as well as any incorrect option, displays a short usage statement that should fit on a standard 80x25 terminal;
- the "-h", or "--help", option displays detailed help information;
- the "-v", or "--verbose", option adjusts the verbosity level; multiple "-v" options (up to 3) should increase the verbosity level, as described in the official guidelines;
- There are a few other reserved options that should not be used for other purposes:
- "-t" or "--timeout" (plugin timeout);
- "-w" or "--warning" (warning threshold);
- "-c" or "--critical" (critical threshold);
- "-H" or "--hostname" (name of the host to check).
6.2 Plugin return codes
Nagios determines the status of a host or service based on the return code of the plugin. Valid return codes are:
| Numeric value | Service/Host status | Service Status description | Host status description |
|---|---|---|---|
| 0 | Ok/Up | The plugin was able to check the service and it seemed to work correctly | The host is up and replied in acceptable time |
| 1 | Warning | The plugin was able to check the service, but it didn't seem to work correctly or it exceeded some "warning" threshold | The host is up, but some "warning" threshold was exceeded |
| 2 | Critical/Down | The service was not running or it exceeded some "critical" threshold | The host is down or some "critical" threshold was exceeded |
| 3 | Unknown | Invalid command line arguments were supplied or an internal error occurred | Invalid command line arguments were supplied or an internal error occurred |
The warning and critical thresholds are usually set via command line options (see above).
6.3 A sample plugin script
Just a couple of notes before moving to a practical example:
- plugins can access macros as environment variables; such variables have the same name as the corresponding macros, with "NAGIOS_" prepended. For instance, the "$HOSTNAME$" macro will be accessible through the "NAGIOS_HOSTNAME" environment variable;
- always specify the full path of any system commands run from your plugins.
Well, so let's see, as an example, what a plugin to monitor the amount of free memory on the local machine could look like:
/usr/local/libexec/nagios/check_free_mem.sh
#!/bin/ksh
################################################################################
# Sample Nagios plugin to monitor free memory on the local machine #
# Author: Daniele Mazzocchio (http://www.kernel-panic.it/) #
################################################################################
VERSION="Version 1.0"
AUTHOR="(c) 2007-2008 Daniele Mazzocchio (danix@kernel-panic.it)"
PROGNAME=`/usr/bin/basename $0`
# Constants
BYTES_IN_MB=$(( 1024 * 1024 ))
KB_IN_MB=1024
# Exit codes
STATE_OK=0
STATE_WARNING=1
STATE_CRITICAL=2
STATE_UNKNOWN=3
# Helper functions #############################################################
function print_revision {
# Print the revision number
echo "$PROGNAME - $VERSION"
}
function print_usage {
# Print a short usage statement
echo "Usage: $PROGNAME [-v] -w-c "
}
function print_help {
# Print detailed help information
print_revision
echo "$AUTHOR\n\nCheck free memory on local machine\n"
print_usage
/bin/cat <<__EOT
Options:
-h
Print detailed help screen
-V
Print version information
-w INTEGER
Exit with WARNING status if less than INTEGER MB of memory are free
-w PERCENT%
Exit with WARNING status if less than PERCENT of memory is free
-c INTEGER
Exit with CRITICAL status if less than INTEGER MB of memory are free
-c PERCENT%
Exit with CRITICAL status if less than PERCENT of memory is free
-v
Verbose output
__EOT
}
# Main #########################################################################
# Total memory size (in MB)
tot_mem=$(( `/sbin/sysctl -n hw.physmem` / BYTES_IN_MB))
# Free memory size (in MB)
free_mem=$(( `/usr/bin/vmstat | /usr/bin/tail -1 | /usr/bin/awk '{ print $5 }'` / KB_IN_MB ))
# Free memory size (in percentage)
free_mem_perc=$(( free_mem * 100 / tot_mem ))
# Verbosity level
verbosity=0
# Warning threshold
thresh_warn=
# Critical threshold
thresh_crit=
# Parse command line options
while [ "$1" ]; do
case "$1" in
-h | --help)
print_help
exit $STATE_OK
;;
-V | --version)
print_revision
exit $STATE_OK
;;
-v | --verbose)
: $(( verbosity++ ))
shift
;;
-w | --warning | -c | --critical)
if [[ -z "$2" || "$2" = -* ]]; then
# Threshold not provided
echo "$PROGNAME: Option '$1' requires an argument"
print_usage
exit $STATE_UNKNOWN
elif [[ "$2" = +([0-9]) ]]; then
# Threshold is a number (MB)
thresh=$2
elif [[ "$2" = +([0-9])% ]]; then
# Threshold is a percentage
thresh=$(( tot_mem * ${2%\%} / 100 ))
else
# Threshold is neither a number nor a percentage
echo "$PROGNAME: Threshold must be integer or percentage"
print_usage
exit $STATE_UNKNOWN
fi
[[ "$1" = *-w* ]] && thresh_warn=$thresh || thresh_crit=$thresh
shift 2
;;
-?)
print_usage
exit $STATE_OK
;;
*)
echo "$PROGNAME: Invalid option '$1'"
print_usage
exit $STATE_UNKNOWN
;;
esac
done
if [[ -z "$thresh_warn" || -z "$thresh_crit" ]]; then
# One or both thresholds were not specified
echo "$PROGNAME: Threshold not set"
print_usage
exit $STATE_UNKNOWN
elif [[ "$thresh_crit" -gt "$thresh_warn" ]]; then
# The warning threshold must be greater than the critical threshold
echo "$PROGNAME: Warning free space should be more than critical free space"
print_usage
exit $STATE_UNKNOWN
fi
if [[ "$verbosity" -ge 2 ]]; then
# Print debugging information
/bin/cat <<__EOT
Debugging information:
Warning threshold: $thresh_warn MB
Critical threshold: $thresh_crit MB
Verbosity level: $verbosity
Total memory: $tot_mem MB
Free memory: $free_mem MB ($free_mem_perc%)
__EOT
fi
if [[ "$free_mem" -lt "$thresh_crit" ]]; then
# Free memory is less than the critical threshold
echo "MEMORY CRITICAL - $free_mem_perc% free ($free_mem MB out of $tot_mem MB)"
exit $STATE_CRITICAL
elif [[ "$free_mem" -lt "$thresh_warn" ]]; then
# Free memory is less than the warning threshold
echo "MEMORY WARNING - $free_mem_perc% free ($free_mem MB out of $tot_mem MB)"
exit $STATE_WARNING
else
# There's enough free memory!
echo "MEMORY OK - $free_mem_perc% free ($free_mem MB out of $tot_mem MB)"
exit $STATE_OK
fi
Subscribe to:
Posts (Atom)